
About Health Profiles
Health profiles allow portfolio and project managers to get an automatic measure of project/portfolio/task health based on parameters configured by your organization, avoiding manual steps and providing an objective reflection of health. Health profiles and their visual indicators let you easily answer questions such as:
-
How are projects performing?
-
What is the current status?
-
Where are the problems?
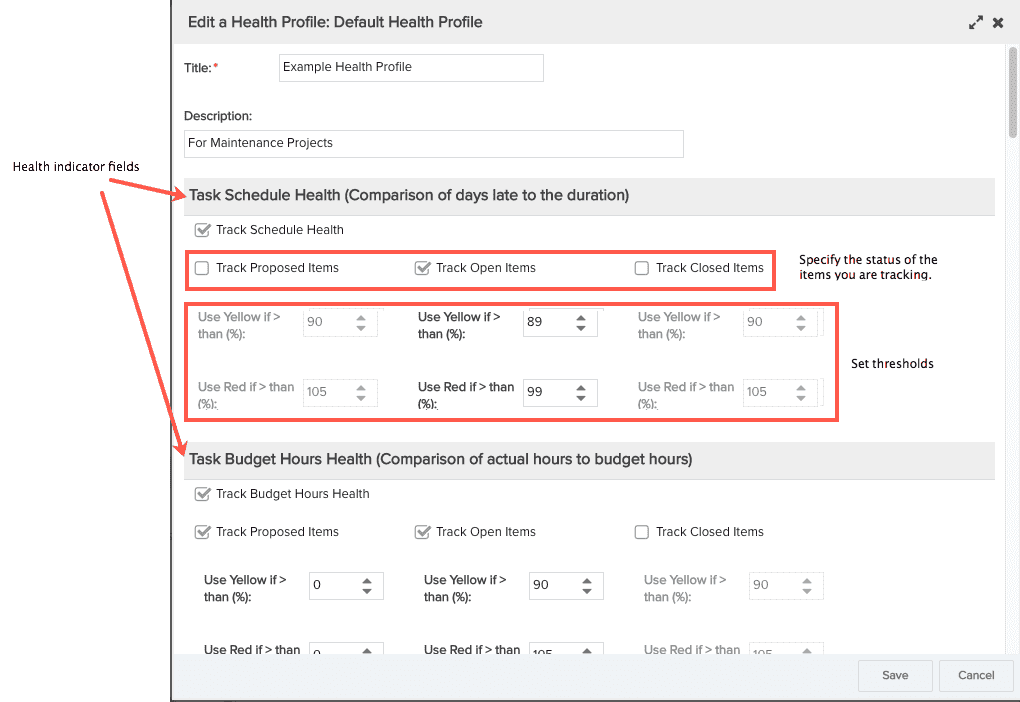
A health profile is a set of "health indicator" fields for which you configure thresholds - the different thresholds correspond to different indicator colors to visually denote the health of the area being tracked. For each field you track you can specify which items to consider based on the implied status - Open, Proposed, Closed - and configure thresholds for each item/status. The health indicator fields are listed below. You can create health profiles for projects and portfolios; tasks use the health profile of their parent project, which include task health indicator fields.
For example, the profile in the screenshot below helps you track if a task is going to complete on time. It generates the Task Schedule Health value for all Open tasks, and the thresholds determine how to display the value via indicator colors. For example, if a task Duration is 10 days, it will will hit 80% complete in 8 days, with 2 days left to complete the task. The profile below is configured to show the indicator in yellow when the value is greater than 89% (note that the threshold is configured for 89%, meaning it goes into effect at 90%). You might set the threshold lower to raise a warning flag earlier if you are more concerned about preventing a critical project from slipping. For a maintenance project, alternatively, where you are less concerned about the progress, a higher threshold is sensible as you don't want to draw resources away from more critical work. Once the duration is reached (day 10), if the task is still implied Open, the indicator will be red (threshold of 99%), which means the task is late. Note that you can configure thresholds of greater than 100%, if, for example, you don't want to call an item late until it is a day or 2 over the duration.
Green indicators mean that an item is not started (Start Date in future) or In Progress and has not yet exceeded one of the configured thresholds, which in our example is 89%.
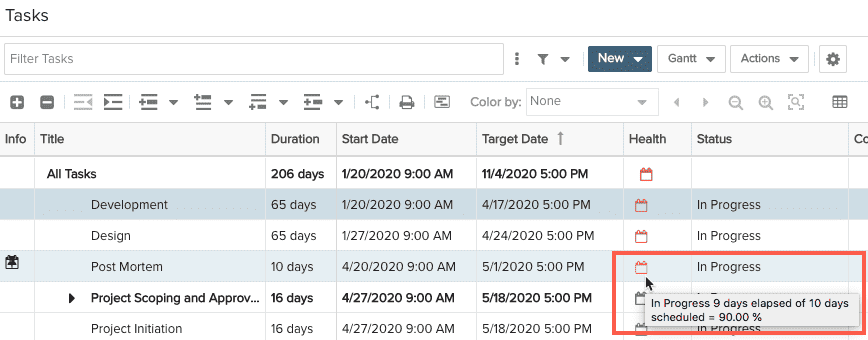
Here is an example of how a Schedule indicator displays in the UI - you can hover your cursor over the icon to see a textual description (hover in the product, won't work if you hover here in the doc �� ).
Project Health Profiles
Project Schedule Health rolls up from tasks. The "most late" summary task value is what drives the project Schedule Health indicator. For example, if there are 5 tasks, and 4 are green and one is red, the project indicator will be red. Task health fields are included in the project health profile of their parent project. The additional project health indicator fields are straight rollups of costs, estimates, and budgets. See How Health Indicator Field Values are Calculated, below.
Portfolio Health Profiles
Portfolio Schedule Health rolls up from projects. The "most late" Project Schedule Health value in the Portfolio determines the schedule health of the portfolio. For example, if a portfolio has 5 projects, and 4 are green and one is red, the portfolio schedule health indicator will be red. The additional portfolio health indicator fields are straight rollups of costs, estimates, and budgets. See How Health Indicator Field Values are Calculated, below.
Reporting on Project/Portfolio/Task Health
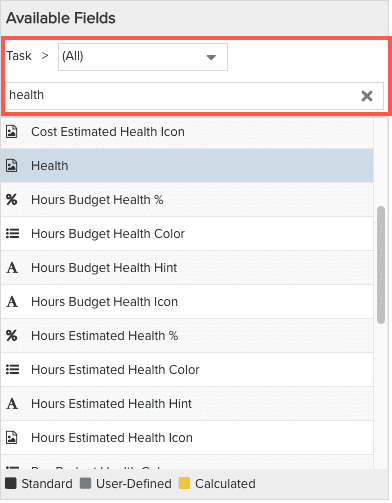
There are a set of report fields that contain the word "Health" - when creating a task/project/portfolio report, for example, search for "Health" in the filter field to display the list of health-related fields. The screenshot below shows you a partial list of fields available for task reports. You can even display the textual representation of using the health icons by using the "Hint" field, such as Hours Estimated Health Hint. The "Health" field is where the icon is displayed.
|
Reporting fields
|
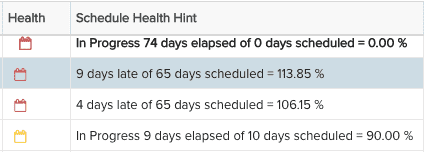
Example of Health Hint and corresponding icon
|
Health Indicator Fields
The table below shows the fields you can include in a health profile, the health icon associated with each field, and which health field/icon is available for each entity. Note that the icons below are shown in black, however they will appear in your system as either red, yellow, or green, depending on how your thresholds are configured.
See Health Indicator Field Definitions for descriptions of how the health indicator field values are derived.
| Icon | Health Indicator Field (in Health Profile) |
Available for Tasks |
Available for Projects |
Available for Portfolios (roll up from projects) |
|---|---|---|---|---|
| Schedule Health (Dates) | ||||
| Budget to Actual Hours | ||||
| Budget to Actual Cost | ||||
| Budget to Actual Revenue | ||||
| Estimate to Actual Hours | ||||
| Estimate to Actual Cost | ||||
| Estimate to Actual Revenue |
How Health Indicator Field Values are Calculated
PPM Pro provides a set of "health indicator" calculated fields for portfolios, projects, and tasks that compare the Schedule (Start and Target Dates), Budget and Estimated Hours, Cost and Revenue to current actuals.
Every value is calculated to-date:
(Duration from Start to Today() / Duration from Start to Target) * Total <#> cost
where <#> is budgeted cost, estimated cost, budgeted revenue, or estimated revenue
All fields can be configured to track items with Open, Proposed, and/or Closed status.
| Health Indicator Field from Health Profile | How Value is Calculated |
|---|---|
|
Project: Schedule Health |
(Target Date days late + days duration)/days duration for Active tasks
|
|
Task: Schedule Health |
(Target Date days late + days duration)/days duration for Active tasks |
|
Project or Task: Hrs Budget Health (Budget to Actual Hrs) |
Actual Hours/Budget Hours to Date |
|
Project or Task: Cost Budget Health (Budget to Actual Cost) |
Actual Cost/Budget Cost to Date |
|
Project or Task: Revenue Budget Health (Budget to Actual Revenue) |
Actual Revenue/Budget Revenue to Date |
|
Project or Task: Hrs Estimate Health (Estimate to Actual Hrs) |
Actual Hours/Estimate Hours to Date |
|
Project or Task: Cost Estimate Health (Estimate to Actual Cost) |
Actual Cost/Estimate Cost to Date |
|
Project or Task: Revenue Estimate Health (Estimate to Actual Revenue) |
Actual Revenue/Estimate Revenue to Date |
|
Portfolio: Schedule Health |
The "most late" Project Schedule Health value in the Portfolio |
|
Portfolio: Hrs Budget Health (Budget to Actual Hrs) |
Actual Portfolio Project Hours/Portfolio Budget Hours to Date |
|
Portfolio: Cost Budget Health (Budget to Actual Cost) |
Actual Portfolio Project Cost/Portfolio Budget Cost to Date |
|
Portfolio: Revenue Budget Health (Budget to Actual Revenue) |
Actual Portfolio Project Revenue/Portfolio Budget Revenue to Date |