
Editing Report Components in Dashboards
When you drop a report onto a dashboard, any variable settings configured for the report (filters, dates, frequency) remain intact. You can leave the settings as-is, change them, or remove them altogether - this will not impact the filters or time series or titles/headings on the standalone report, only how the report is rendered in the dashboard. In addition, you can determine whether to allow dashboard consumers to change these setting interactively, while viewing the dashboard. This is useful, for example, if the report is initially filtered to all projects with Status = Proposed; if allowed to change the filter, the dashboard consumer can re-filter the report to their interests, such as all project with Status = Open.
You can modify the following properties of a report component (exact properties available for a component determined by output type):
- The Heading section of the Display tab (the exact settings are determined by the report output type)
- Auto-sizing and column header wrapping for List:Basic reports and their cousins Gantt, Crosstab, and List:Stacked
- Variable filters (filters, dates, frequency)
You can also remove reports from a dashboard.
To modify dashboard components, use the Content Options modal (see below), which contains a list of all the dashboard components and provides access to the settings for each. Alternatively, you can edit each component separately by opening its Component Actions Menu (also below). NOTE that the dashboard designer Preview area is truly only for previewing. You can only edit report options within the Content Options modal or a Component Actions Menu option; changes made to reports directly within the Preview area, such as sorting a List report column or hiding columns must be done within the report designer, not the dashboard designer.
Content Options Modal
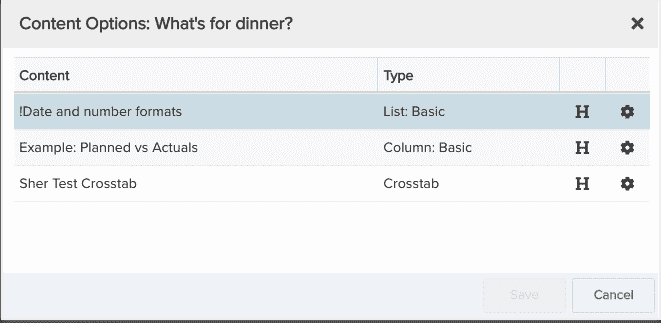
To view all the current dashboard's report components in a list and edit systematically, click the Edit Content Options icon  on the top-right corner of the Preview pane to display the Content Options modal (shown below for the dashboard titled "What's for Dinner").
For each report component you can:
- click
 to display the Headings Section for the report. Displays the heading options for the component output type.
 - click
 to display the Variable Settings for the report. Displays the filter options derived from the report topic and any related entities.
 - notice that the Content value is the original report name, which is useful if you've changed the report title in the dashboard and want to know the original report title
Once you are done editing, click Save.
Component Actions Menu
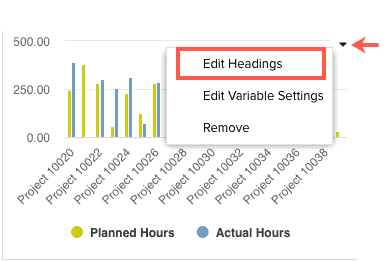
To edit one component at a time, use the Actions menu at the top-right corner of each component to Edit Headings, Edit Variable Settings, or remove the component from the dashboard.
 the mo
Adding/Editing Headings
|
Choose the Edit Headings option, either from an individual component or clicking the
|
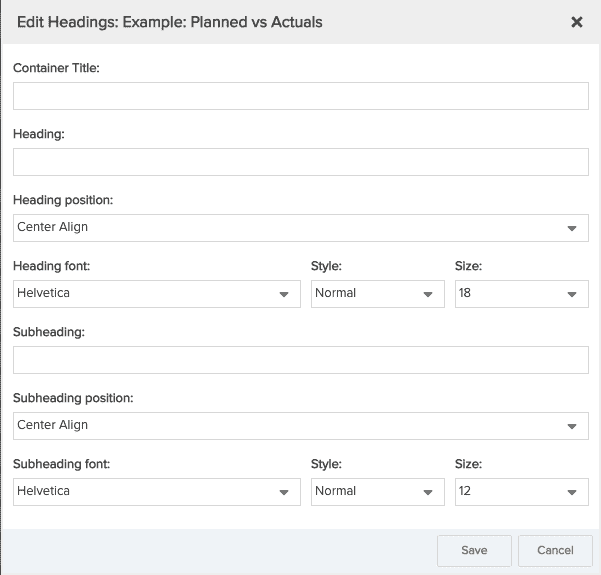
A Edit Headings modal for a bar chart is shown below. You can edit any of the titles and headings - the changes will NOT be reflected in the original report. The settings presented will depend on the type of report. For example, the screenshot below shows the Heading section for a bar chart. If it were a list report, as shown in the next section, you'll only see a couple of settings in the Edit Headings modal.
|
Auto-sizing List Components, Wrapping Column Titles
The Headings section for List/Gantt/Crosstab contains display settings that apply to list-type reports that render rows of data.
Editing Dashboard and Report Headings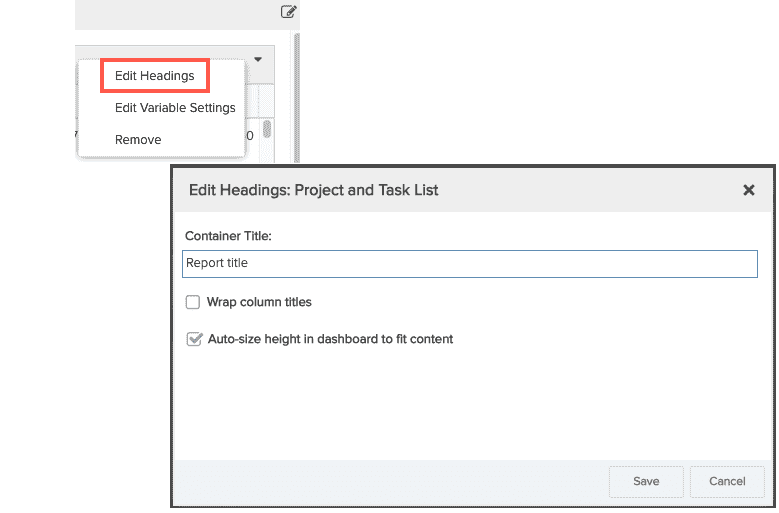 |
Edit Headings menu - Choose this menu for options to set/override report properties (menu is available from the Preview pane in any tab):
|
Variable Settings (Filters, Dates, Frequency)
|
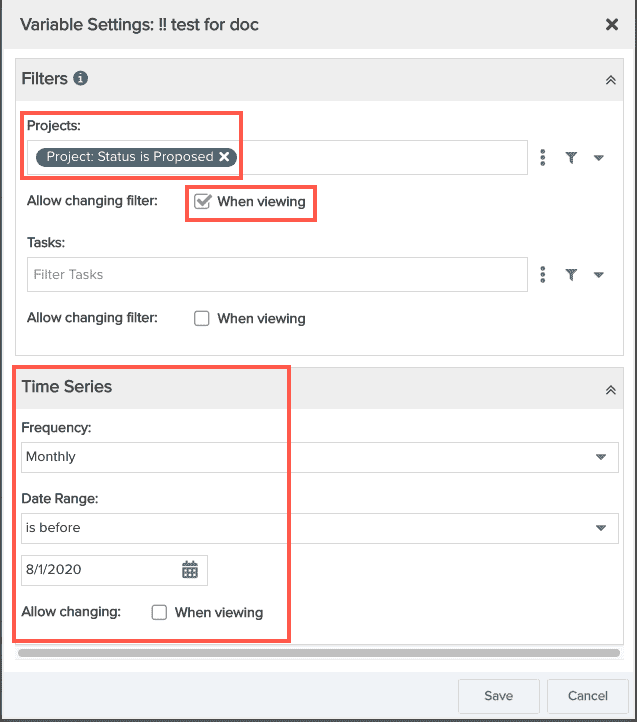
Default settings Any variable settings configured in the original report appear in the dashboard report component. For example, the screenshot to the right shows the settings from the original report: a project filter (Status is in Progress) and "Allow changing filter: When Viewing' is selected for the project filter. There is also the option to include a Task filter (because the report includes task fields), but no filter value was included on the original report. Filters There can be one or more ad-hoc filter controls for each report component; the number of controls depends on the report topic and whether the report definition includes additional entities. In the example to the left, the report topic is "Project" and the report includes tasks - so there is an ad hoc filter control for each. Whether filter values are included depends on whether the builder of the report included them. Regardless of how the underlying report is set up, you can leave the settings as-is, or make changes. For example, you might decide that you want to allow dashboard consumers to use a Task filter, simply enable the 'Allow changing filter: When Viewing' checkbox for the task. Any changes you make here are NOT reflected back in the original report. Date Range/Frequency If the report component is a Time Series, then there will be default settings in the Variable Settings modal. As shown in the screenshot, the default is Frequency = Monthly, with a specified date range. Leave as-is, change, and/or give dashboard consumers the ability to change by enabling 'Allow changing: When viewing'. |
 |
Remove a Report Component
To remove a component from a dashboard, open its Actions menu and choose Remove. This simply removes the report component from the dashboard - it does NOT delete the report.