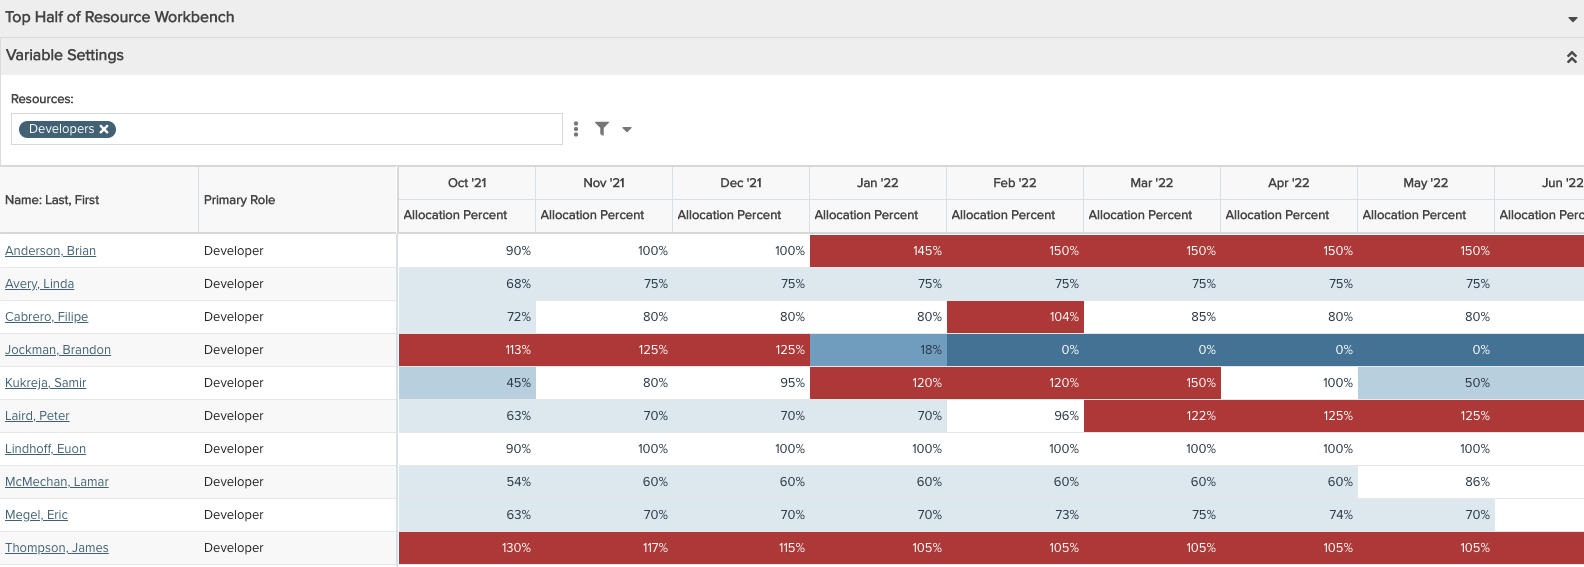
Resource Workbench Utilization aka Top Half of Home/Resources View
Displays resource utilization, *almost* mimicking the top half of Home/Resources view (also known as the Resource Workbench). *Almost* because the Resource Workbench automatically filters out Implied Closed projects, whereas this report will display allocation percents based on all projects. So if you have resources allocated to one or more closed projects for the time period displayed, the values will not exactly match what is in the Resource Workbench top half of the grid. You can build this report using the design settings in the table below. Alternatively, you can download this report definition and upload it to your PPM Pro instance.
| Design View | Selection | Comments |
|---|---|---|
| General |
Topic: Resource Specialty: Time Series Type: List: Time Series Title: <enter a meaningful title>
|
|
| Data |
List Fields: Add whichever of the following resource and other fields that would be of value and/or match the Resource Workbench Resource Columns settings, such as:
Time Series Fields: Only available fields that have a time series indicator appended to their titles - such as '(Time Series)', or '(Allocated Roles - Time Series)' - should be added to this section (hint: search Available Fields list for 'time series'). From the Resource available fields add the following:
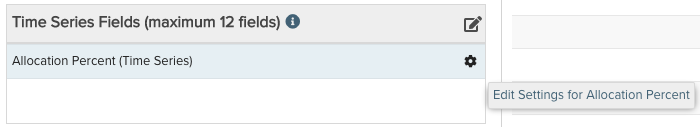
Adding Background Colors: Within the Time Series Fields area select the gear icon to edit settings for the Allocation Percent field:
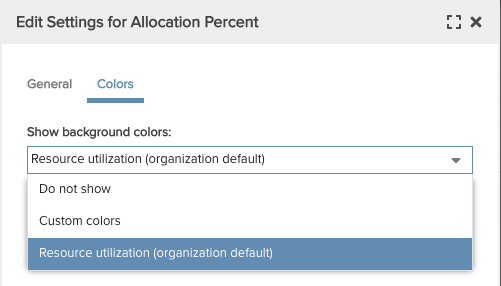
Select the Colors tab and the Resource utilization option:
Selecting the Resource utilization option will provide background colors per your organization resource settings, allowing you to closely match the Home/Resources view. If you see different values and colors, it may be the difference between the Home/Resources view (Resource Workbench) automatically filtering out Implied Closed projects, whereas this report will display allocation percents based on all projects. So if you have resources allocated to one or more closed projects for the time period displayed, the values and colors will not exactly match what is in the Resource Workbench top half of the grid. |
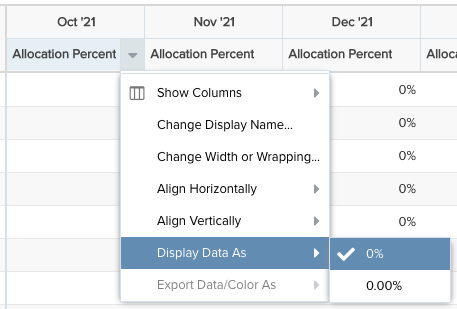
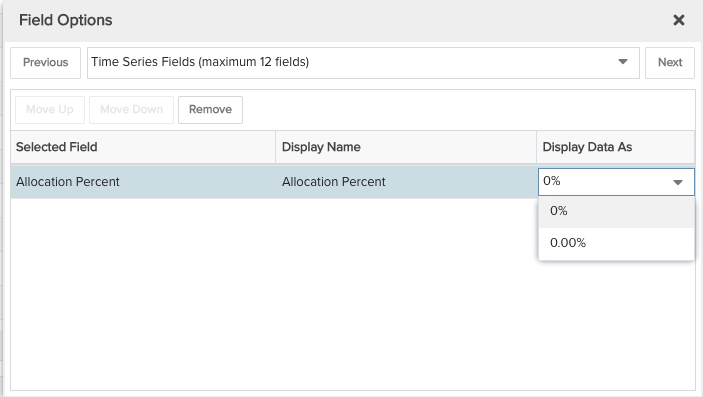
To change the Allocation Percent to show without decimals and match the Resource Workbench, either in the Preview pane within any of the Time Series column title menus select 'Display Data As' and '0%':
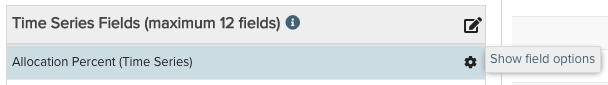
Or, within the Time Series Fields area select the edit icon for "Show Field Options" and in the resulting "Field Options" modal, edit the Display Data As:
|
| Display |
Configure desired options within the Display tab, such as:
|
|
| Variable Settings |
Scope: Organization, so that the report will appear in the Organization/Reports grid Filters: Any resource filters Time Series: Select a Frequency and Date Range appropriate to your report needs, to match the Resource Workbench this could include:
|
If you would like to allow changing Filters or the Time Series selections before running the report or when viewing the report, select the 'Allow changing' checkbox options for each. For example, you might want to allow changing the filters When viewing to mimic the Resource Workbench. |