
Working with the Project List page
This video demonstrates how to navigate the Projects list view. Duration: 4.5 min.
The Projects List is the screen that displays when you click the Projects navigation icon,or the  link above the left-nav panel of a project. This page displays all the projects that you either own, have edit/view rights to, or whose team you belong to. You can format project grid data (for example, add color, format dates, time, and currency) using the "Display Data As..." feature - see Formatting Column Values below.
The Project List page is the starting place for creating projects and viewing project details. For more information about projects, see About Projects.
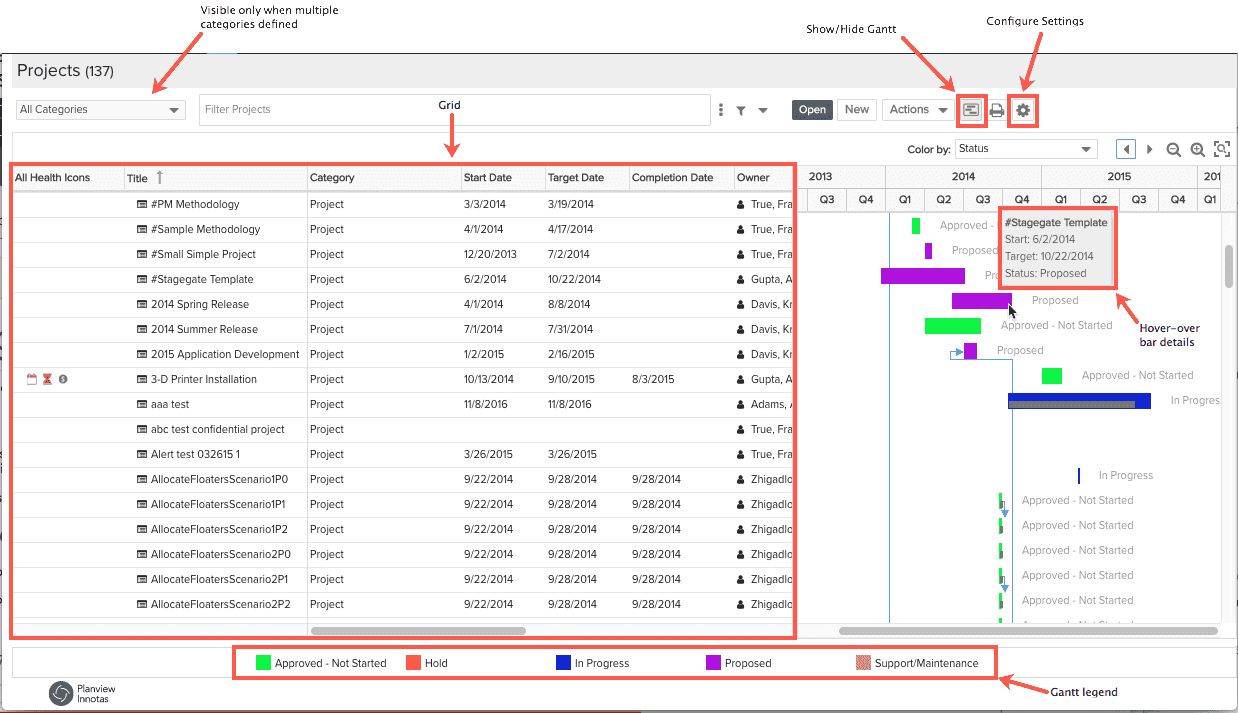
Anatomy of the Projects List page
Below is a screenshot of the Projects List page. To open a project, select it and click the Open button, select a project and choose Actions > Open, or double-click on any field in a row.
You can return to this page directly from a specific project by clicking View All Projects in the upper-right corner of the project, or by clicking the Projects navigation icon.
Editing and Selecting Records
To edit grid values, double-click the row and make edits in the various sections.
Select single records by single-clicking; use shift-click to select multiple records (or hold down the shift key and hit the down arrow key repeatedly). When you select more than one record, the message "n items selected" is displayed (temporarily) in the footer of the page. This is useful if you want to select a range of records and want to know the count.
Customize the List Contents by Category
Note: Category droplist not visible if only one category is defined.
An entity list often displays entities (for example, projects, issues) from several categories. Since categories don't necessarily include the same fields, the list might include fields that are relevant for one entity but not for another. You can filter by category AND display a set of columns specific to the category by using the Category droplist at the top-left of the screen.
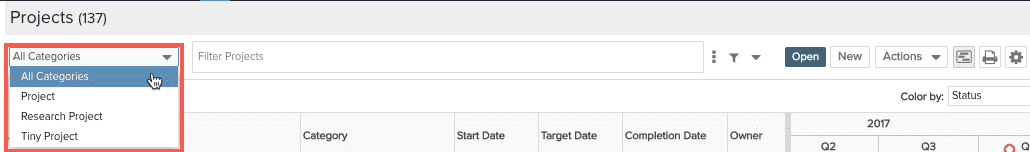
Select a category and add, remove, and rearrange columns. Repeat for each category. The column configurations will persist for each category.
The All Categories selection mimics legacy behavior and shows entities from all categories in one list. Choose the category you are interested in working with, and the list will filter out entities of other category types and will display the list contents according to how you configured it.
Formatting Column Values
NOTE
The ability to format column values is available for list reports and entity grids (Issue/Project Log List, Portfolio List, Project List, Request List, and Task List). Since this feature works the same way in either context, we are covering it in one topic. You might see references to both entity grids and list report columns.
For entity grids, the formatting is specific to each user - there is not currently a way to specify global formats. Note that if you choose Reset To Default Settings from the resource menu, you will lose your formatting entity grid formatting.
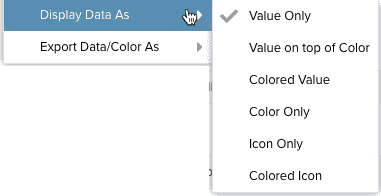
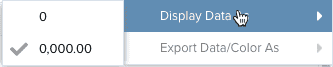
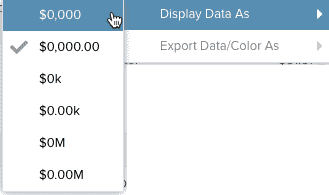
In the context of a List report or the entity grids mentioned above, an extensive header menu option called "Display Data As" is available for applying formatting to list fields, number fields, and date/time fields. The screenshot below (left) shows the Display Data As menu for a numeric fields with a currency data type; the screenshot below (right) show the Display Data As menu option for a list field:
|
Display Data As for numeric (money) fields
|
Display Data As for list fields
|
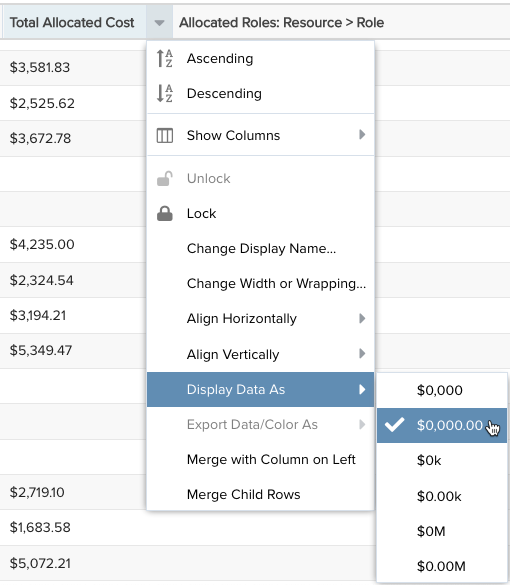
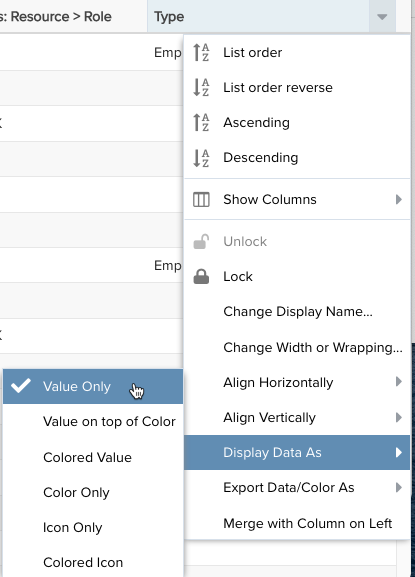
Formatting Data - "Display Data As"
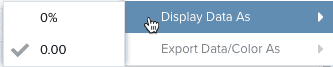
The Display Data As menu header item is dynamic - it displays different menu items depending on the type of field you have selected. For example, select a lookup list and choose Display Data As to apply color to the value in the field, or the background, or both. If you select a numeric field, you'll get various options to specify things like the number of decimal places or currency indicator, whether to format percent fields to display whole numbers or decimals...and so on.
The Display Data As menu options for the different fields types are described below. Note that this menu is also available for entity grids, such as the Projects List, the Requests List, and the Tasks list.
Fields Types:
The formatting options for the above field types are described below:
| Menu Item | Description |
|---|---|
|
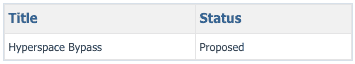
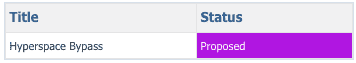
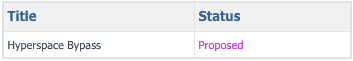
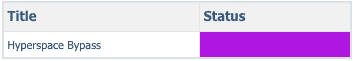
Lookup lists can be assigned a color and/or an icon for each list value. When using a lookup list in a report/grid that is configured to use color/icon, you can choose the visual treatment to apply to the list field value by configuring the "Display Data As" setting. Note that Pie charts and Column charts automatically use any lookup list color assignment.
|
Lookup List Examples: The Display Data As list field options are shown below, along with an example of each:
|
|
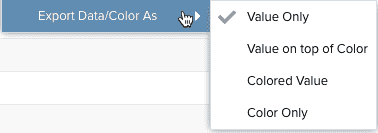
Export Data/Color As If you plan to export a report/entity grid that makes use of lookup list values that render color and/or icons, this options lets you specify how to treat the value/color when exporting. Note that icons cannot be exported as they only exist within PPM Pro.
|
Options are (see Display Data As, above, for examples):
|
|
Note: You can format numeric data values of non-list reports by using the Field Options modal. The following number types can be formatted with the Display Data As menu item: Percent Choose to show decimals or round to whole number.
Float Choose to show decimals or round to whole number.
Money Choose no decimals, 2 decimal places, thousands (k) and millions (M) representatives.
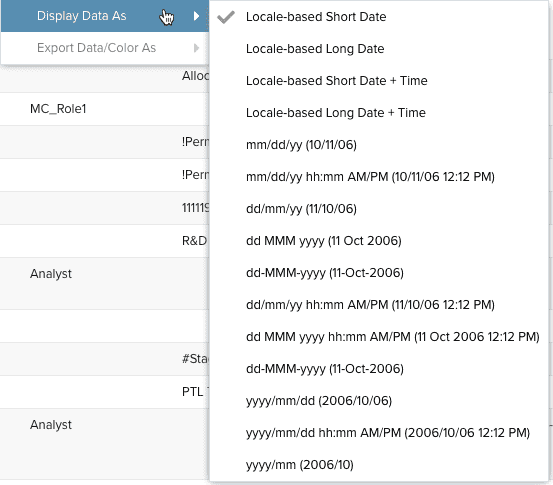
Choose from a large variety of date and date/time formats. Remember that as you choose a format it renders immediately in the Preview Pane, so try out different options. The date format examples are represented in each option label.
|
Values round up using conventional rounding standards - round up at a value of 5 or higher. Understanding the rounding is important when choosing the level of precision you want to use.
Percent Example: 32% or 32.36%
Float Example: 432 or 432.05
Money Examples: $0k $0.00k $0M $0.00M
|
Add/Remove/Rearrange and Sort Columns
You can determine the columns that appear in an entity grid using the Configure Column Settings dialog. Click the Configure Columns gear icon to display the dialog.
![]()
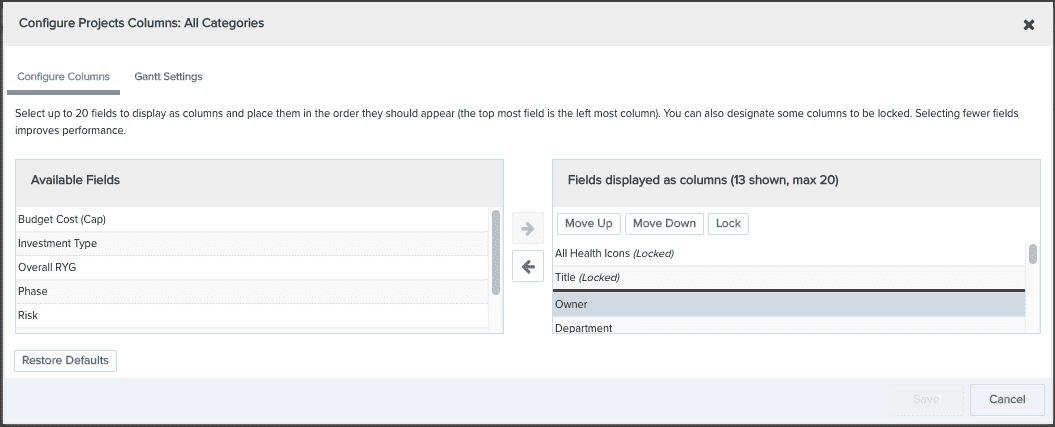
- To add columns to the grid, select them in the Available Fields pane and then click the right-arrow. To remove columns, select them in the right-hand panel and click the left-arrow. You can display 20 columns max. The list of fields available in this dialog is determined by the project category, which is configured by an PPM Pro administrator.
- You can select one or more columns to remain "locked" to the left of the screen in the non-scrolling region, preventing them from scrolling out of view. The Title field for an entity is locked by default. To lock an additional column, select the field and click the Lock button. To move a column into the scrolling section of the grid, select it and click the Unlock button (on appears once you select a locked column other than Title).
- You can move columns to any position in the grid by simply dragging the column header in the grid. Or, you can change their position by clicking the Configure Settings icon and using the Move Up/Move Down buttons to reorder the columns.
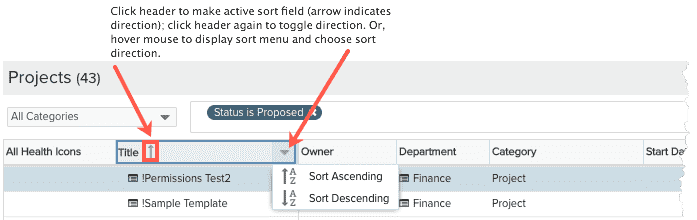
Sorting
To sort a list, simply click on a header. An arrow pointing up indicates ascending sorting; down indicates descending. Alternatively, click your cursor in the header to display the sort menu and choose the sort order - ascending or descending.
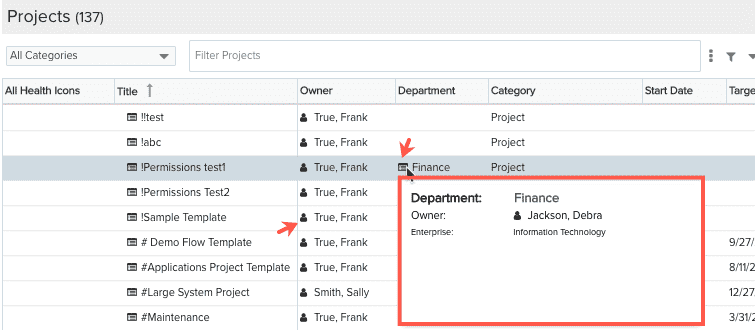
Entity Info Quick View
You can quickly display important information about other entities related to a project without having to navigate away from the Projects lists. Click the ![]() icon next to the name of any entity (such as business unit, department - the resource icon looks like
icon next to the name of any entity (such as business unit, department - the resource icon looks like ![]() ) to display a snapshot for the selected entity. Click the entity name link to navigate to the Info screen of the entity.
) to display a snapshot for the selected entity. Click the entity name link to navigate to the Info screen of the entity.
The New Menu
The New menu contains one or more category, or type of project. If your organization uses one project category only, then there is no menu, just a New button. Click the New button to invoke the New Project Wizard and create a new project.
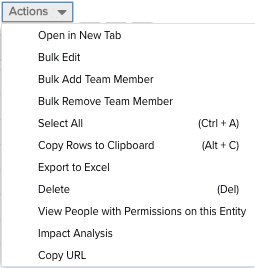
The Actions Menu
The Actions menu at the top of the list holds all operations that you can perform on projects in the list. You can also access this menu by right-clicking on a project. Perform bulk actions by selecting multiple records (Shift-click or Ctrl-click) and then choosing an operation from the Actions or right-click menu.
 |
Menu Option |
Description |
|
Open (context menu only) |
Open selected project in same window. |
|
|
Open in New Tab |
Open the selected project in a new tab. |
|
|
Bulk Edit |
Opens an editor that allows you to edit multiple projects. Select the project (Shift-click or Ctrl-click to select multiple rows) and then choose Bulk Edit. See Bulk Editing for more information. |
|
| Bulk Add Team Member | Use to add users, groups, or units to the teams of multiple projects to quickly provision project permissions. See Bulk Sharing Permissions. | |
| Bulk Remove Team Member | Use to remove users, groups, or units from the teams of multiple projects. See Bulk Sharing Permissions. | |
| Select All | Selects all the projects in the list. | |
| Copy URL | Copies the URL to the current project. | |
|
Copy Rows to Clipboard |
Copy the selected rows to the clipboard. (Shift-click or Ctrl-click to select multiple rows.) |
|
| Export to Excel |
Export a maximum of 5000 list rows to Microsoft Excel. If you export 5000+ rows, you will be notified that your export will be truncated and encouraged to run a report to accommodate the large number of rows. Reports can handle up to 50,000 rows. See Printing the Projects List. |
|
|
Delete |
Deletes the selected project. |
|
| View People with Permissions on this Entity | Displays the Permissions Explorer with the focus on the current project. See Using the Permissions Explorer. | |
|
Impact Analysis |
Invokes the Impact Analysis tool in a new window with the currently selected project as the focal point. See About Impact Analysis. |
Using the Gantt Chart
Click the Show/Hide Gantt toggle ![]() to display or hide the Gantt chart. Use the Color By drop list to choose which field you want to differentiate by color. Hover your mouse cursor over any bar to view the project name, start date, target date, and owner (as shown above). See Using the Project Gantt Chart for more information.
to display or hide the Gantt chart. Use the Color By drop list to choose which field you want to differentiate by color. Hover your mouse cursor over any bar to view the project name, start date, target date, and owner (as shown above). See Using the Project Gantt Chart for more information.
Out-of-the-Box Project Filters
PPM Pro supplies a set of out-of-the-box (OOTB) filters - OOTB filters always preceded with a + sign :
- Status: +Proposed
- Status: +Open
- Status: +Closed
- +My Projects - returns all projects where current user is owner or member of project team
You can map the status filters to a custom status. This is called having an implied status. For example, you might have a status called "under review," which maps to Proposed, and thus has an implied status of Proposed.
Filtering Projects
Use the "ad-hoc" filter just as you would on any on page. See Ad-Hoc Filters for more information. The Project grid list has a maximum of 500 records when viewing.