
Setting up the PPA environment
This video provides an overview and setup of the Predictive Portfolio Analysis (PPA) engine. Duration 4.5 min.
Before you create a scenario you need to identify at least one field on which to base your optimization. Think carefully about this, as picking a numeric project field that truly represents the value you want to optimize on is the most important driver for PPA to provide the best results. Common optimization fields include project Score, Revenue, or other Financial user-defined fields (UDFs). You'll want to select or even create a meaningful optimization field and ensure that each project evaluated has a value for it.
Please note, although any numeric project field can be an optimization field, it will help if the optimization field's values across projects are of a similar scale as the project cost. For example, often one project's cost will be double, 10 times, or even 100 times what another project's cost is, while the optimization field's values are more similar and clustered around a common number range. Given the differences in scale, for projects with such wildly varying costs that have close to the same optimization values (in the same cluster), you will see that PPA will develop a bias towards the smaller cost projects, because the bigger cost projects will never have enough score to justify their cost (which might or might not be what you want). A way to combat this is to ensure the optimization values have a similar scale to the project cost scale, which can be done by ensuring the optimization values conform to Fibonacci numbers or other non-linear numbers such as 1, 5, 10, 50, 100, 500 (as opposed to 1, 2, 3, 4, 5, 6, 7, 8, 9, 10).
By default, there are no fields configured for use; you must add at least one field. It's a good idea to select a handful of fields that reflect a quantifiable project benefit, of an appropriate scale, and meet your optimization needs. You specify these fields in the Optimization Fields tab of the Settings dialog.
There are several other configuration options that have default values. You can optionally modify these defaults:
-
Optimization Fields tab - configure utilization values
-
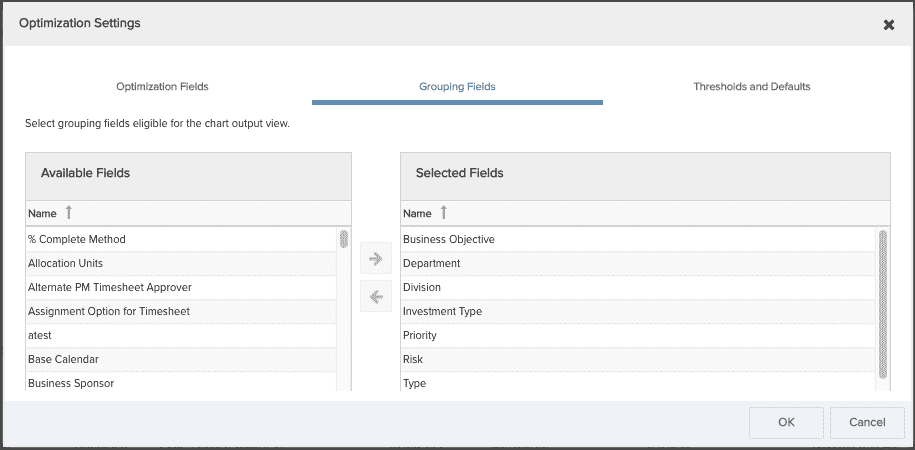
Grouping Fields tab - choose fields by which to group the scenario Chart output. These fields are typically lookup lists fields such as Project Type or Department. Recommend choosing a list with no more than 15 values.
-
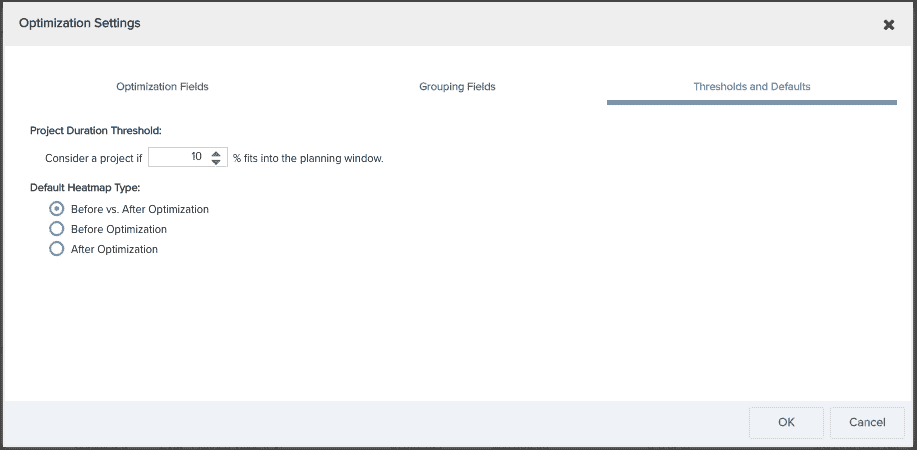
Thresholds and Defaults tab - configure what percentage of a project must fit in the time horizon to be able to include the project in a scenario, and pick the heatmap type to display by default (you can configure heatmap color gradients in Admin/Organization/Resource Settings).
To set up the PPA module
- Navigate to the PPA tab and click the Settings button
 to display the Optimization Settings dialog.
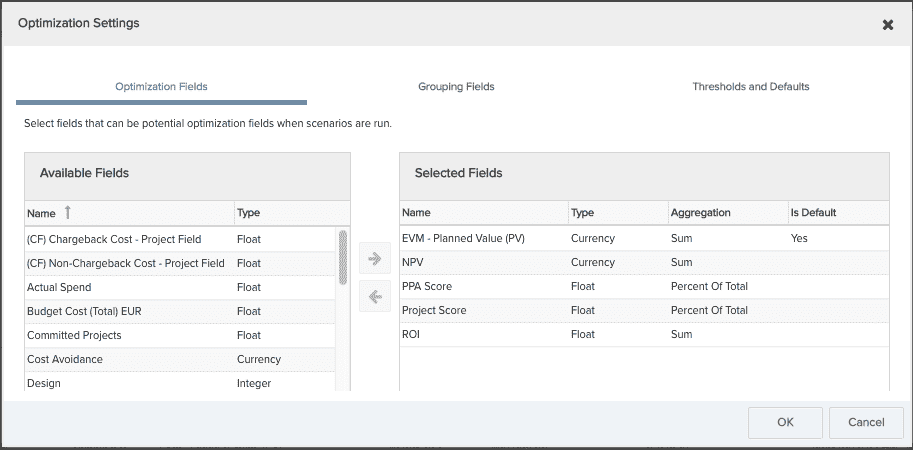
- Choose the project numeric Available Fields that you want to offer as optimization inputs and click the right-arrow button to move them to the Selected Fields. The fields you choose will populate the "Optimize For" droplist when creating a scenario, as well as provide the comparison fields when comparing two scenarios. You typically only want a handful of meaningful optimization fields to prevent unnecessary clutter.
- Pick the type of aggregation - options are Sum or Percent. The system will pick a logical default.
- (Optional) Select a default optimization field. The default field will be selected in the Optimize For droplist in the Create Scenario wizard. This is useful if you create lots of scenarios that use the same optimization field.
- (Optional) Click the Grouping Fields tab to select fields that you can use for grouping within the scenario output Chart tab. For example, a grouping of None (always an option) results in all the bubbles in the bubble chart mingled together. If you have a field call Business Objective, for example, then the bubbles will be grouped by business objective so it will be easy to see what business objective the projects fall into. The fields you choose will populate the Group By droplist in the output. Avoid removing a grouping field that was used in previous saved scenarios, because that will affect existing chart output.
- (Optional) Click the Thresholds and Defaults tab to specify what percentage of a project must fit in the time horizon to be able to include the project in a scenario. For example, if you are planning for one year and the threshold is set to 75%, then roughly 9 months of the project must take place during the horizon (PPA always evaluates in weeks, so this is approximate). The default value is 30%. Note that if a project is only partially included in the planning horizon, both the cost and the value of the optimization parameter will be prorated on the scenario output Scorecard accordingly (if 75% of a project is included, 75% of the cost and 75% of the benefit will be added to the Scorecard).
- (Optional) Click the Thresholds and Defaults tab to configure default settings for the scenario output Heatmap tab. You configure the displays for all resource utilization graphics throughout the PPM Pro product on Admin/Org/Resource Settings. For PPA, you can additionally choose the type of heatmap to display by default: Before vs. After Optimization, Before Optimization, or After Optimization. You can view all three options, this just configures the default view.
- Click OK.
Now your users are ready to create scenarios.