
Project Logs
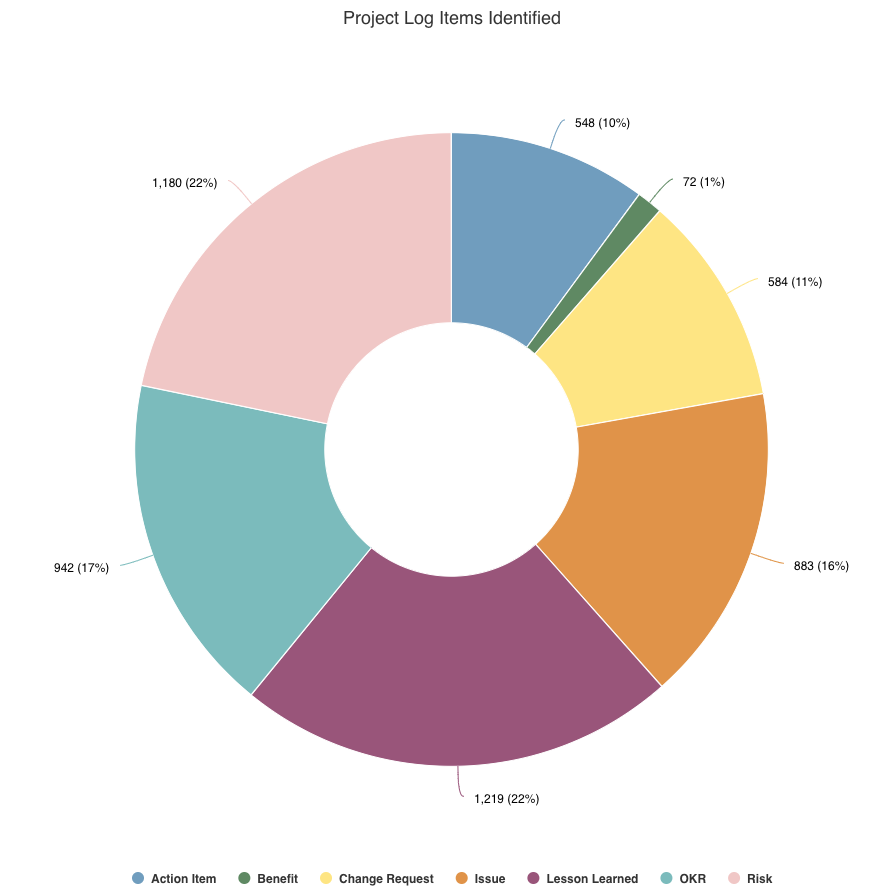
This report shows how many different project logs or issues exist for a project or set of projects. For example, see a donut chart showing the total number of project logs per project category. You can build this report using the design settings in the table below. Alternatively, you can download this report definition and upload it to your PPM Pro instance.
| Design View | Selection | Comments |
|---|---|---|
| General |
Topic: Project Log (or Issue, Log, whatever this entity might be called in your company) Type: Donut Title: <enter a meaningful title>
|
Other report Types that work well include Bar: Basic, Column: Basic, and Pie: Basic.
|
| Data |
Group By: Category Values: Count |
|
| Display |
Set desired Display options, such as:
|
|
| Variable Settings |
Scope: Project Filters: optionally include a project log filter
|
Selecting the Project Scope will cause this report to be available on Project Report grids so it can be run per project. You can select other Scope options if you want this report to be show in other entity grids as well. As needed, you can also include Filters. If you want to allow the user to change to a different Scope and/or Filter before running the report or when viewing the report, select the relevant checkboxes for Allow changing. |