Project Overview
This report show a simple project overview containing key information in a stacked display format, which can be used across a set of projects or per project for use on a project status dashboard. You can build this report using the design settings in the table below. Alternatively, you can download this report definition and upload it to your PPM Pro instance. Please note that if you use the report definition file to create this report in your instance, the user-defined field used in this example recipe will not be in your instance and you may want to select another field in the resulting report to balance the stacks or change the number of stacks to 3.
| Design View | Selection | Comments |
|---|---|---|
| General |
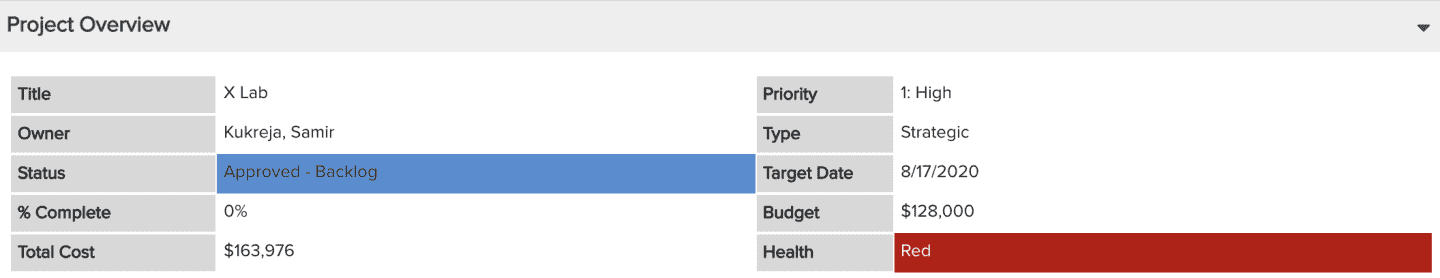
Topic: Project Type: List: Stacked Title: <enter a meaningful title>
|
You can also provide an overview for any entity by changing the Topic, for example for portfolios, tasks, project logs, and so on. This example is for a List: Stacked report type, but you could instead simply use a List: Basic if you prefer all the information in a single row for each entity. |
| Data |
List Fields: Whichever of the following and others would be of value, for example relevant financial fields, such as
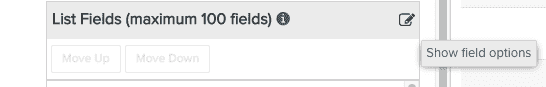
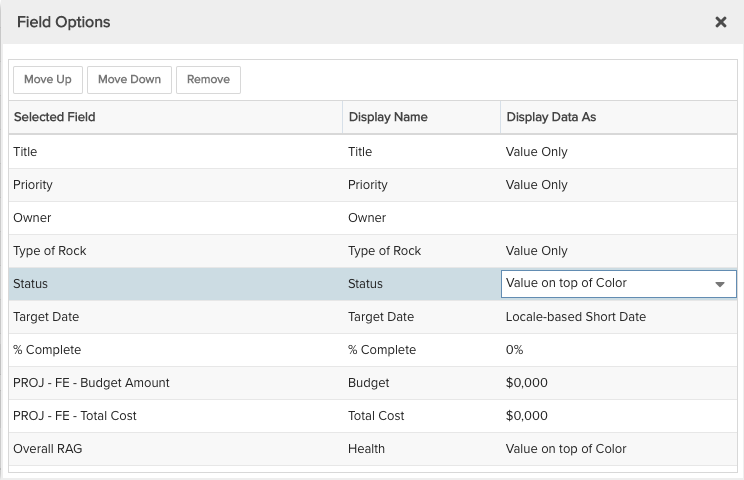
To change the field title values and/or field value format for the report stacks, you can use the Field Options modal. For example, to show Status as "Color on top of value", within the List Fields area title select the edit icon for "Show Field Options" and in the resulting "Field Options" modal, edit the field "Display Name".
|
When selecting fields, the order in which they appear is how they are distributed across the number of stacks you display (see Display tab below for setting the number of stacks). For example, if in the selected List Fields you have in order Field 1, Field 2, Field 3, Field 4, Field 5, and Field 6, then when: 2 Stacks are displayed -
3 Stacks are displayed -
Note that if the number of selected List Fields do not evenly distribute across the number of stacks, the last field(s) will span stacks. This may not be a bad thing, depending on your design intent, just something to consider and play with using the Preview. This report is an example showing a user-defined field "Overall RAG" that is a lookup list. Please note that if you download the report definition file, this user-defined field will not be in your instance and you will need to select a different List field in the resulting report, especially to balance the stacks per above. |
| Display |
Configure desired options within the Display tab, such as Stacks, Sorting, or Drilldown.
|
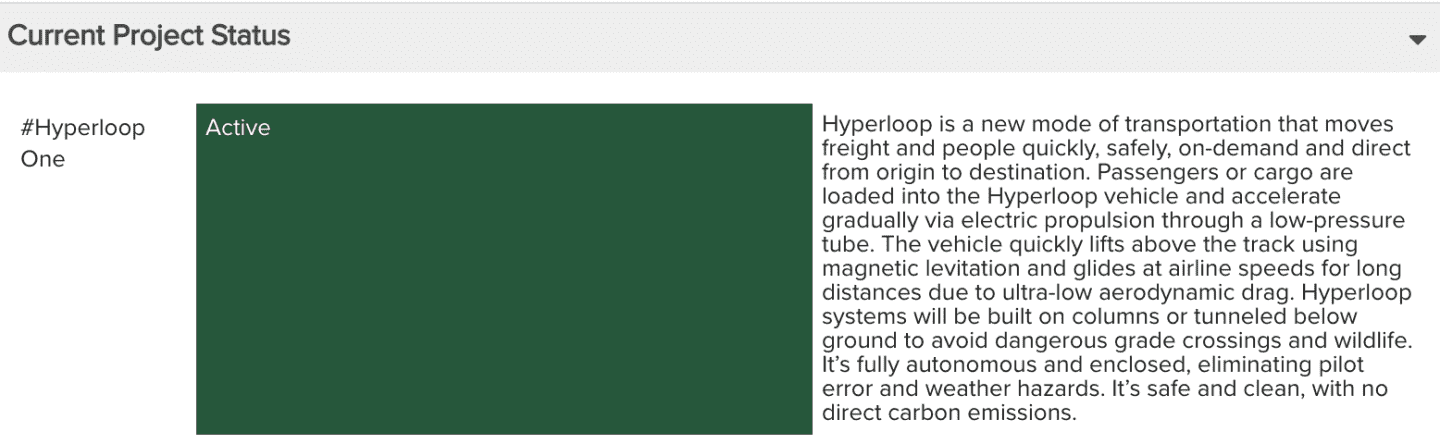
Note that you can hide a stack's titles or values completely by setting a Fixed Width of 0. For example, if you would like your overview to simply show the project Title, Status, and Description with only these values displayed, set the relevant stack's Title to Fixed Width with a value of 0:
|
| Variable Settings |
Scope: Project Filters: optionally include project filters
|
Selecting the Project Scope will cause this report to be available on Project Report grids. You can select other Scope options if you want this report to be shown in other entity grids as well, such as Portfolio to run across a set of projects belonging to a portfolio. As needed, you can also include Filters. If you want to allow the user to change to a different Scope and/or Filter before running the report or when viewing the report, select the relevant checkboxes for Allow changing. |