Resource Planning Terms and Influences
There are three ways to represent resource data: headcount/hours, percent, or Full-Time Equivalent (FTE). The data is influenced by three factors: project calendar, resource calendar, and Organization FTE setting. It is important to understand how the calendars and the FTE value impacts the interpretation of the data.
Note that headcount, percent (of time), and FTE are concepts that PPM Pro users frequently use interchangeably when describing how resources are allocated - however, these terms are very different. The confusion often starts while staffing a project - you might think of planning by percent of time or FTEs, but technically only headcount and hours are valid modes of planning.
Resource Data Terms
- Headcount/hours are used when staffing a project; headcount is converted to hours based on the project's calendar. It obeys the project calendar when staffing both roles and resources. Headcount is used as the multiplier against project working days/hours and considers any events. Behind the scenes, all staffing data is stored in hours. Headcount is not a reportable value.
- Percent is used in various calculations around capacity and is driven by the resource’s calendar. Typically, you see Percent in Capacity & Demand, Resource Workbench, and Resource Planning report sources, though it may be in other report sources.
- FTE is an organization-wide value set in Admin that is used in various calculations around capacity. It considers a working day to be any day between Monday - Friday, and is driven by no calendar. Typically, you see FTE in Capacity & Demand and Resource Planning report sources, though it may be in other report sources.
Examples
Below is an example project with staffing and the outputs in Capacity & Demand as well as the Resource Workbench.
Staffing by Headcount (Project Calendar Perspective)
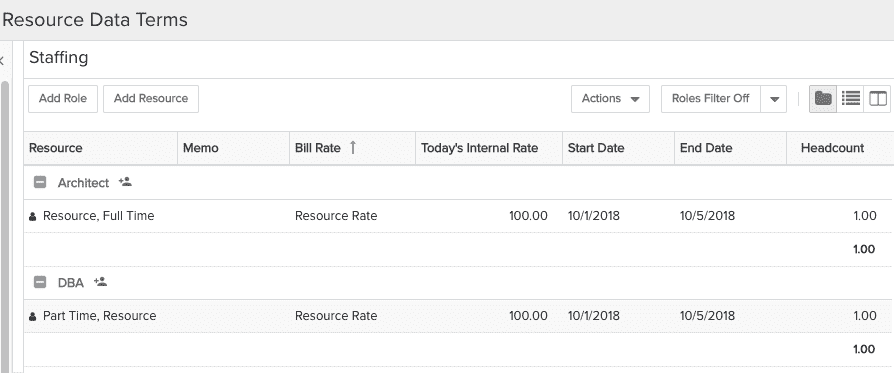
For this example, one full-time resource and one part-time resource are allocated to the project. The project calendar is set to a 40-hour work week (Monday - Friday, 8 hours/day):

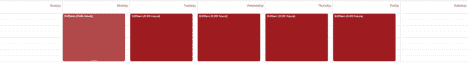
The full-time resource has a capacity of 40 hours per week (Monday - Friday, 8 hours/day), as defined by the resource's calendar:

The part-time resource has a capacity of 20 hours per week (Monday - Friday, 4 hours/day) as defined by the resource's calendar:
The full-time and part-time resources have been allocated for 1 Headcount for one week:
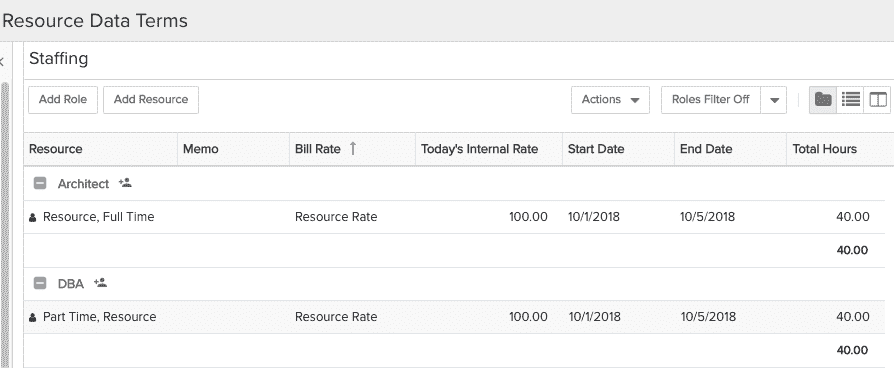
As noted above, all data is stored in hours. By changing the Staffing view to hours (see below), you will see that the part-time and full-time resources are allocated for 40 hours, which is derived from the Project Calendar not the Resource Calendar. As a result, both resources are allocated to the project for 40 hours.
Capacity & Demand
The Capacity & Demand Resource option allows you to view the data from the following perspectives:
- Hours – Representing exactly what was entered as allocated, scheduled, or actual hours.
- Percent – The resource calendar' s perspective of hours, which is derived by dividing the Resource Calendar capacity hours for the given time period by the allocated, scheduled, or actual hours.
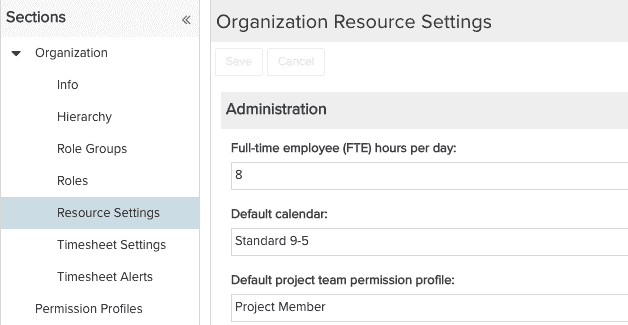
- FTE – Is the Organization's perspective of hours, which is derived by dividing the allocated, scheduled, or actual hours by the FTE Hours Per Day value. This value is set on the Admin/Org/Resource Settings page. FTE represents a standard working day.
In this example, FTE has been set to 8.
Using the same allocations from project Staffing screen in the previous example, the following are the 3 Capacity & Demand perspectives:
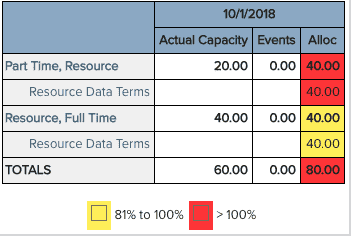
1. Hours – Directly entered allocated hours
The part-time resource in the red because capacity is 20 hours, but allocation is 40 hours.
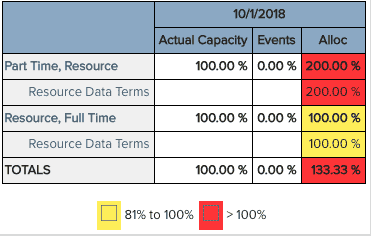
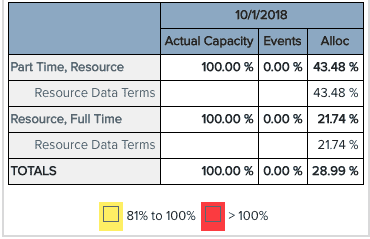
2. Percent – Allocated Hours / Resource Calendar Based Capacity
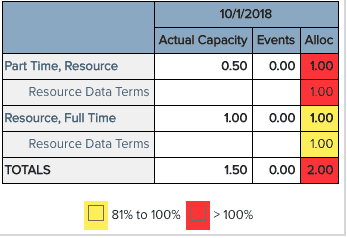
3. FTE – Allocated Hours / Organizational Standard FTE (set to 8 hours/day)
Changing the FTE setting to 7.5 hours per day results in the following:
FTE – Allocated Hours / Organization FTE (set at 7.5 hours/day)

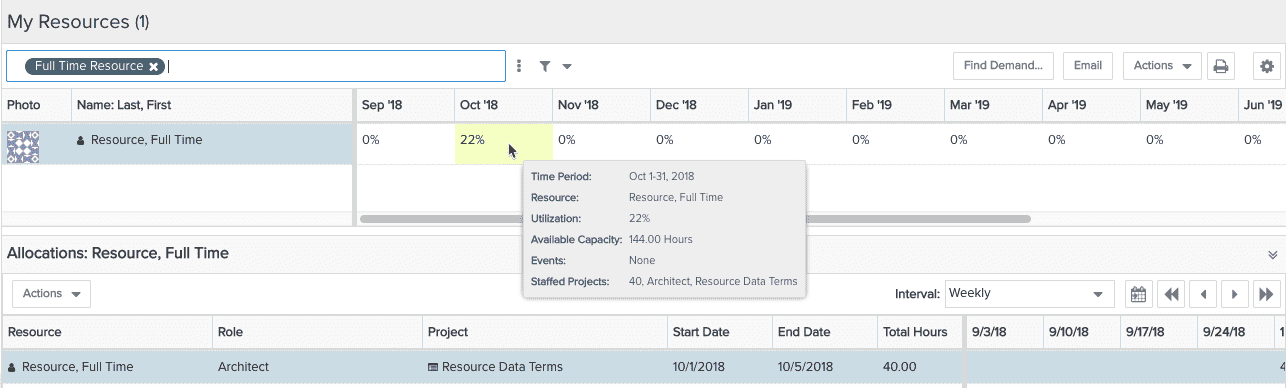
Resource Workbench
The Resource Workbench shows overall resource utilization and the specific project allocations for each resource.
- The Resource List (upper pane) bases its calculations on the Resource calendar (Resource Calendar Perspective)
- The Allocation Details pane (lower pane) bases its calculations on the Project calendar (Project Calendar Perspective)
Because different calendars influence the interpretation of the hours, the headcount in the lower pane will not necessary add up to the utilization number in the upper pane.
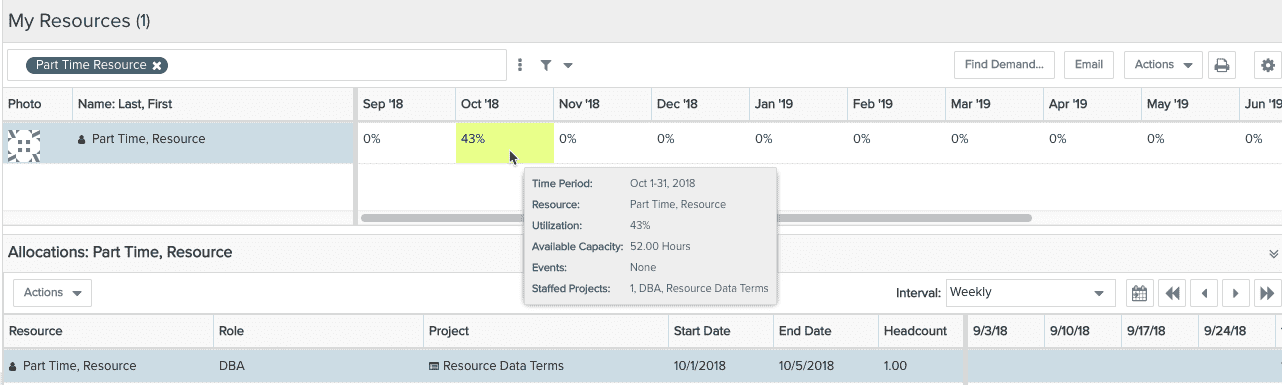
Note: The Resource Workbench only presents a monthly view - the Capacity & Demands screenshots above are presenting one week's data. You can re-run the Capacity & Demand report for Percent by Month, it will reflect the utilization values in the Resource Workbench:
Part-time resource project demand expressed in headcount
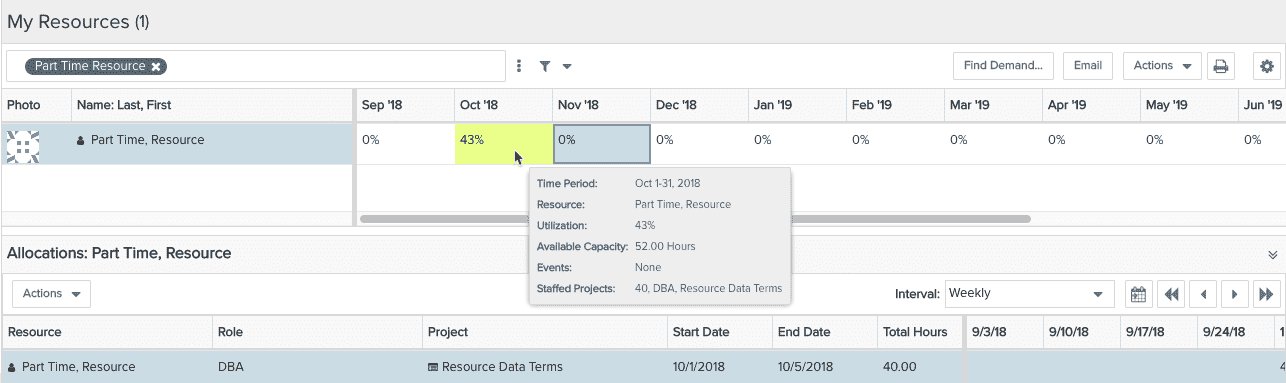
Part-time resource project demand expressed in hours
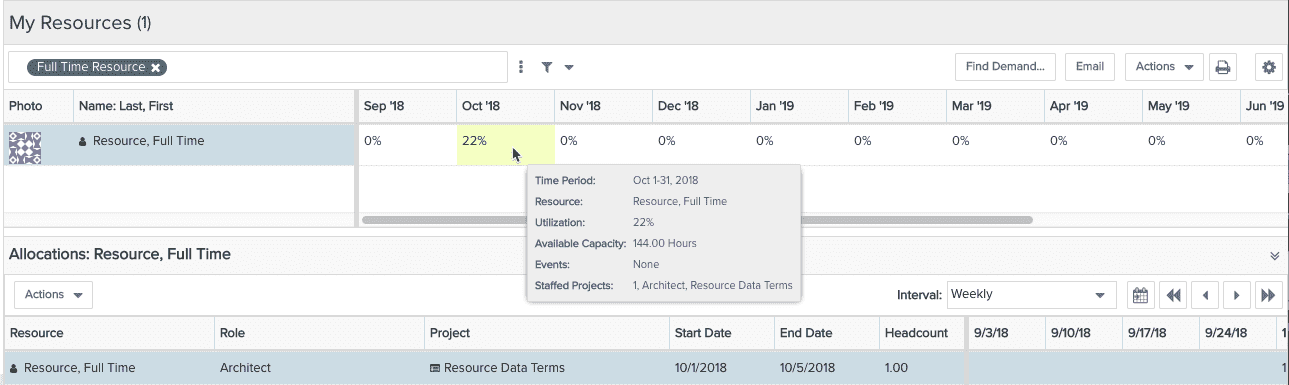
Full-time resource project demand expressed in headcount
Full-time resource project demand expressed in hours