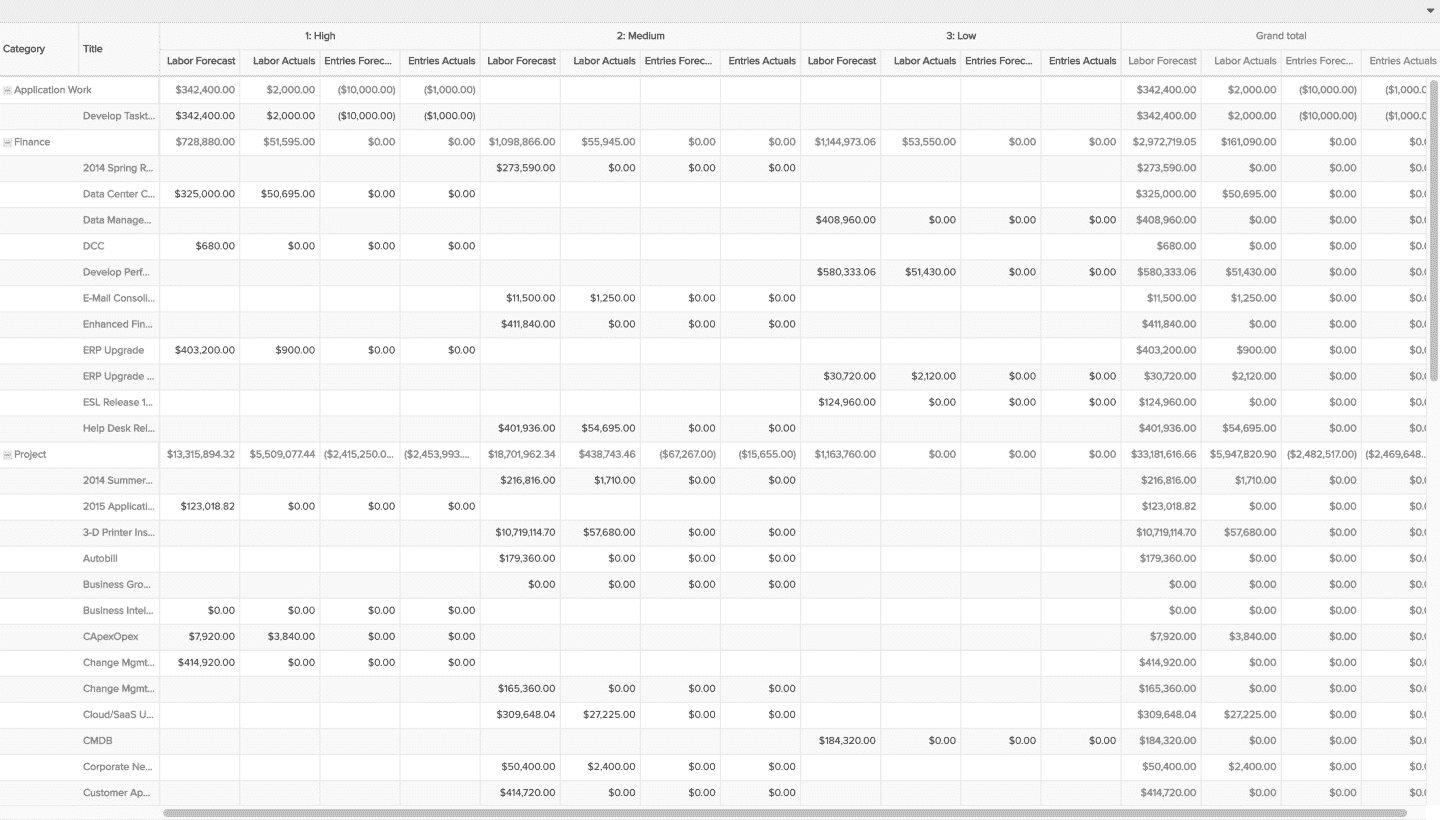
Total Forecasts and Actuals
This report shows your project total forecasts and actuals. For example, see a crosstab showing total costs from Financial Entries Forecasts and Actuals along with Staffing Forecasts and Timesheet Actuals, broken out by project priority and summarized by project category. You can build this report using the design settings in the table below. Alternatively, you can download this report definition and upload it to your PPM Pro instance. Please note that if you use the report definition file to create this report in your instance, the calculated fields used in this example recipe will not be in your instance and you may want to select other Left Axis fields in the resulting report.
| Design View | Selection | Comments |
|---|---|---|
| General |
Topic: Project Type: Crosstab Title: <enter a meaningful title>
|
|
| Data |
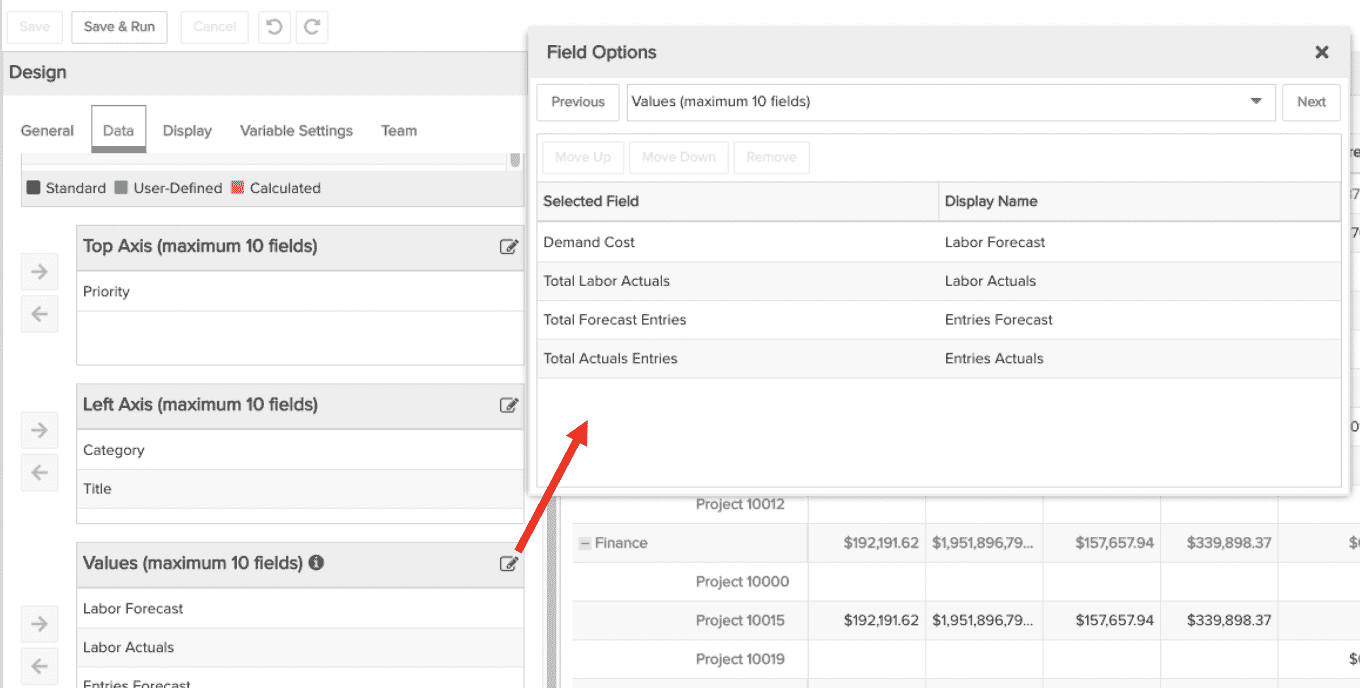
Top Axis: Whichever fields (up to 10) would be of value for breaking up the cost data, such as by Priority, Business Objective, and so on. Left Axis: Whichever fields (up to 10) would be of value for organizing projects, such as by Category, Title, and so on. Values: Whichever fields (up to 10) would be of value for representing costs (and/or revenue) and how you would like them broken out, such as Total Forecast Entries, Total Actuals Entries, Demand Cost (Staffing), Total Labor Actuals (a calculated field [Project].[Total Actual Cost]-[Project].[Total Actuals Entries]), and so on. |
If you would like change the Display Name for one or more of the field titles within the Crosstab columns or rows, click the Edit icon for the appropriate Data field bucket and update in the resulting modal pop-up:
|
| Display |
Select desired options within the Display tab, such as row and column subtotals and grand totals. |
|
| Variable Settings |
Scope: Organization, Portfolio Filters: optionally include project filters
|
Selecting the Organization and Portfolio Scopes will cause this report to be available on the Organization Report and Portfolio Report grids so it can be run per the organization or portfolio, respectively. As needed, you can also include Project Filters. If you want to allow the user to change to a different Scope and/or Filter before running the report or when viewing the report, select the relevant checkboxes for Allow changing. |