
Using the Project Gantt Chart
When you click the ![]() button to show the Gantt chart (or choose Show Gantt Chart from the Gantt menu), the Gantt tools become active.
button to show the Gantt chart (or choose Show Gantt Chart from the Gantt menu), the Gantt tools become active.
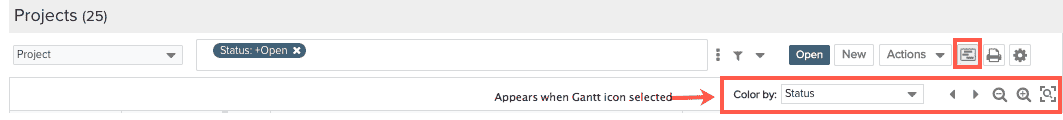
- Color by - The field that drives the color in the chart. The drop list displays any field on the grid that is derived from a list field.
 - Previous interval, next interval
 - Zoom in, zoom out
 - Recenters the diagram to today's date
Gantt Settings
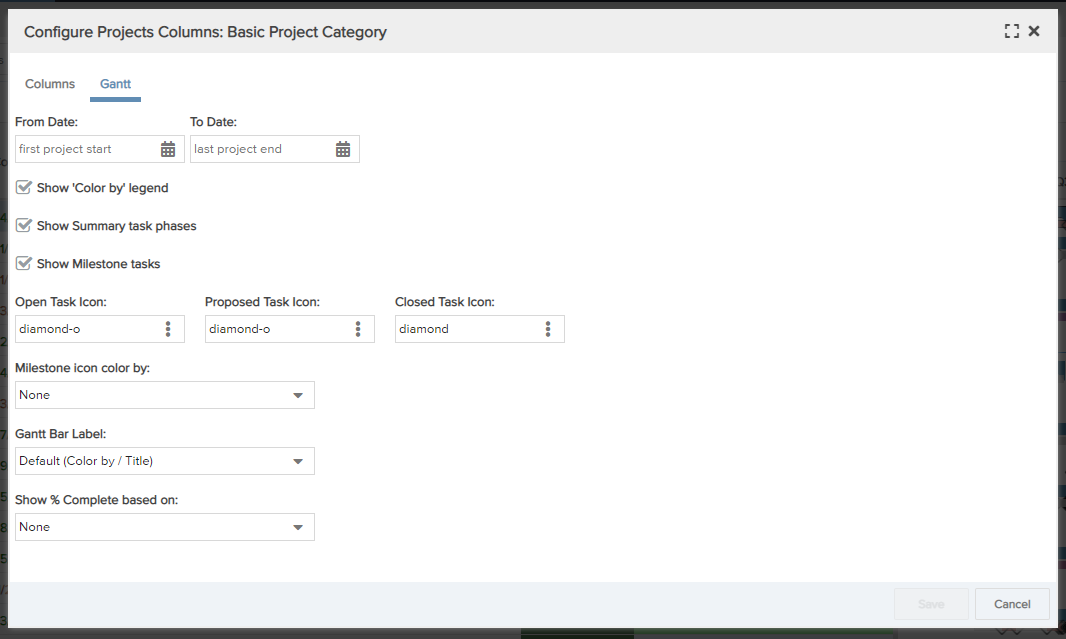
Click the settings icon ![]() to display the Gantt Settings dialog. The configure columns tab is where you choose the fields to display on the projects list. You can reorder the fields here, or simply drag and drop them on the grid.
to display the Gantt Settings dialog. The configure columns tab is where you choose the fields to display on the projects list. You can reorder the fields here, or simply drag and drop them on the grid.
The Gantt Settings tab is where you configure different aspects of the Gantt chart; each setting is described in the table below.
|
Setting |
Description |
|---|---|
| Gantt Date Range | Select the date interval to display. |
| Color By Field |
Select the field to drive the color coding of the Gantt bars. For example, if you color by Project:Type, then each project type is displayed in a different color. Use any column configured on the Gantt Columns tab that represents a discrete list of values. The "Color by Field" value is displayed in the rendered Gantt chart to the left of the interactive controls - it shows the current setting, if any, and can be changed on the chart itself. |
| Show 'Color By' Legend | Check if you want a legend to appear below the project Gantt to show the value represented by each color. |
| Show Summary task phases |
Check to display summary task phases in the Gantt chart.
NOTE In order to see the task phases on the Gantt chart, the following prerequistes need to be met:
|
| Show Milestone tasks | Check to display Milestone tasks in the Gantt chart. |
| Open Task Icon | Select an icon to represent open tasks in the chart. |
| Proposed Task Icon | Select an icon to represent proposed tasks in the chart. |
| Closed Task Icon | Select an icon to represent closed tasks in the chart. |
| Milestone icon color by | Select a field to establish the color coding of the milestone icons. |
| Gantt Bar Label | Select a field whose value will appear as a label to the right of each bar. Use any column configured on the Gantt Columns tab. |
| Show % Complete based on | Select any % field to display a darker shade on top of each Bar #1 to represent the % complete of that field's value. The darker shade gives each bar the appearance of a progress bar. Remember that the field you choose to base % complete on must appear in the projects list grid. This feature is for treating the Gantt bar like a progress indicator, and can be based on any % field, as well as Project % Complete. |
Project Gantt Chart Elements
![]() The following list describes the project Gantt chart elements
The following list describes the project Gantt chart elements
- blue arrows - soft dependencies (project to project, no automatic date updates)
- black arrows - hard dependencies (cross-project task dependencies)
- thin gray bars - complete date
- bar color controls by Color By field
- bar labels controlled by Settings dialog
- details appear when you hover cursor over bar
These are called-out in the screenshot below:
