
Working with the Summary View
Note: You need Project > Edit > Financial Summary permission to edit the summary structure. Editing the structure includes adding, moving, deleting items, entering manual values for fields defined as such, checking/unchecking data streams.
The most efficient approach is to set up a summary for a template project, and then create your project from that template. That way, every new project has a starting point for its summary. It's easy to add/remove and rearrange fields (provided you have edit permission). If your financial summary structure is empty, it is likely that the current project was not created from a template, or created from a template that did not include a summary. See Creating Projects from a Template.
Note the following if you copy a financial summary as part of a project template:
- actuals and values that were manually entered into the summary in the project template will not be copied into the new summary
- if you include tasks in the project template, then any values assigned to those tasks, such as task Budget, will feed into the new summary (but will be relevant only if your structure is set up to derive values from the task level budget)
- the date range configured for the summary in the project template will be copied into the new summary, so remember to adjust the settings as necessary in the new summary. See Setting the Rollup Periods for the Summary (Configure Settings).
- Calculation details will be copied into the new summary
Things you can do with the financial summary:
- Adjust which data streams are visible in the project summary
- Override default settings for how to calculate EAC and ETC and set up NPV calculation parameters
- Configure the rollup periods for the structure - both for the monthly range and the previous/next timeframes
- Add fields, indent/outdent
- Edit/View field details (edit if user has appropriate permissions)
- Manually enter values (if manual entry fields exist on your structure)
- Increase/decrease effective value of a field
Anatomy of the Summary Structure
The Summary structure is found under the project Financials/Summary tab:
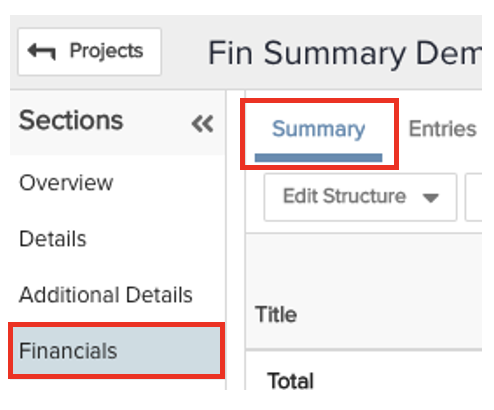
If you do not see the Financials section, or the Summary or Entries tab, please contact your administrator.
The screenshot below shows an empty (no fields/values) summary.
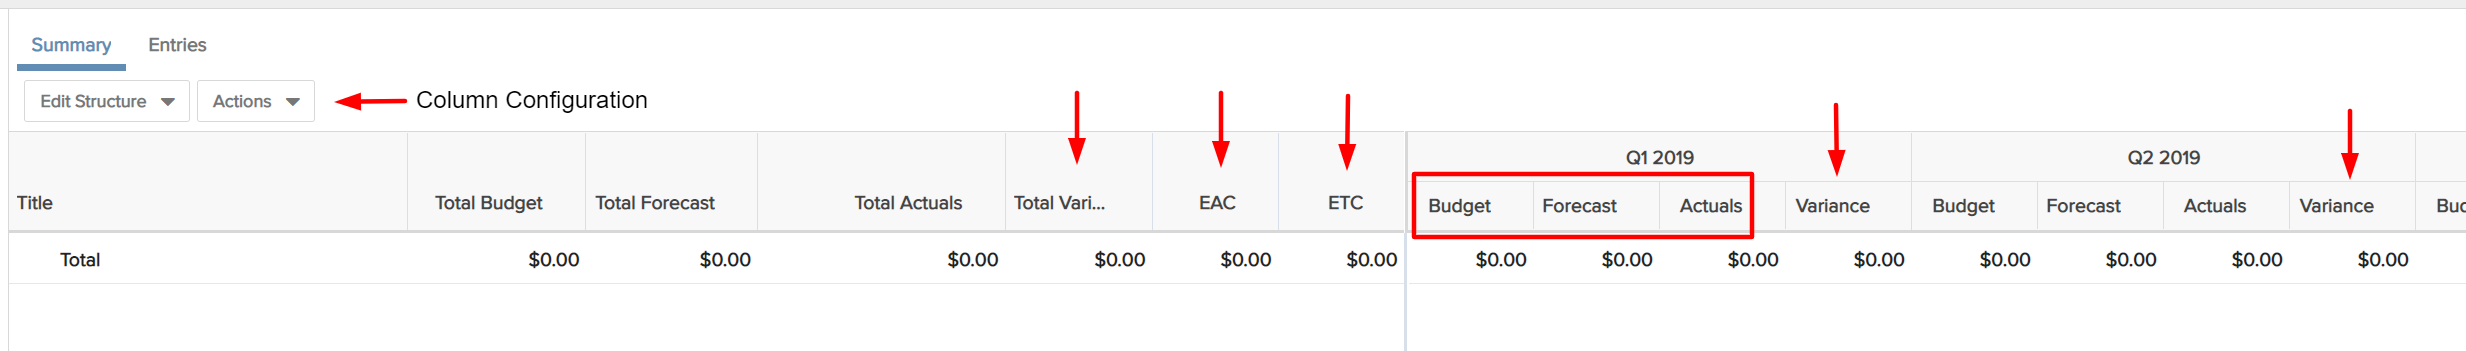
By default the summary displays:
- A "Total" column for each selected data stream (Budget/Forecast/Actuals) and Variance, EAC, and ETC (note that currently EAC and ETC cannot be removed from the grid - in the future we will provide a way for customers to configure their visibility)
- A span of months between the project Start Date and the project Complete Date (or Target Date, if no Complete Date). The system automatically adjusts the Start/Complete dates to align with the first and last months of a quarter, respectively. For more information, and to adjust the display, see Configure Settings dialog.
- A Total row with values of $0.00 for each data stream, variance, EAC, and ETC. The Total fields are populated automatically as you add fields to the summary whose values roll up to the totals.
- The Edit Structure menu and the Actions menu.
The Actions menu
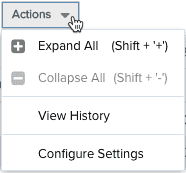 |
Expand All - Select to open/view all items in the Summary. You can expand specific sections of the summary by clicking on the Whatever state you leave the summary in (sections open, closed) will be retained after navigating away and returning. |
|
Collapse All - Select to close/hide all child items in the Summary. You can collapse specific sections of the summary by clicking on the When the summary is fully collapsed (no child items visible), the Edit Values button will be hidden because no manually-editable fields will be visible; the Edit Structure menu will also be hidden because no item/fields will be visible. |
|
| View History - not yet supported | |
| Configure Settings - Opens dialog where you can set the monthly range and other intervals, and override default settings for how to calculate EAC and ETC and set up NPV calculation parameters. |
 control or double-clicking the parent record to toggle between expand/collapse.
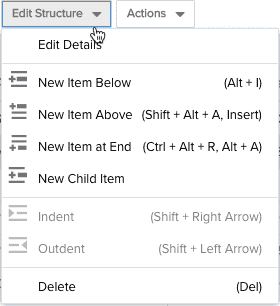
 The Edit Structure menu
|
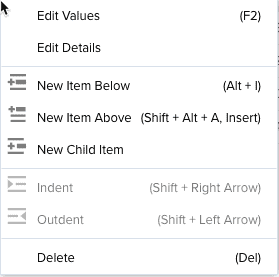
You can also invoke this menu by right-clicking a record in the summary or from the toolbar. When you right-click, the Edit Values menu option appears at the top of the menu, and the New Item at End menu option is not available. Toolbar menu Right-click menu |
Edit Values - (This option available from right-click menu or Edit Values button in toolbar) Click this button to open for edit any field in the monthly range that has be configured to manually edit. This button/menu item is not available when the summary has been collapsed, and does not appear if the summary is empty. |
| Edit Details - Displays the configuration details of the selected field. Some General properties can be edited; constraints, data sources, and filters read only. | |
|
New Item Below/Above - Opens the New Item wizard to insert a new field below/above the selected record. The wizard displays the list of available fields from which the user can choose to add to the structure. Fields can be added only once - the wizard will not display any fields that already exist on the summary. If adding a child field, the list of available fields will be limited to those fields that match the parent's constraints. Also, fields already on the structure will not appear in the list. |
|
|
New Item at End - Opens the New Item wizard to insert a new field after the last record on the summary. The wizard displays the list of available field from which the user can choose to add to the structure. Fields can be added only once - the wizard will not display any fields that already exist on the summary. If adding a child field, the list of available fields will be limited to those fields that match the parent's constraints. Also, fields already on the structure will not appear in the list. |
|
|
New Child Item - Opens the New Item wizard indented below the selected item. The New Item wizard filters the available fields to include only those fields whose constraints match the parent field's constraints (and do not already appear on the summary). If adding a child field, the list of available fields will be limited to those fields that match the parent's constraints. Also, fields already on the structure will not appear in the list. To view the constraints for a field on the summary, select the field and choose Edit Structure > Edit Details (or right-click and choose Edit Details). |
|
|
Outdent/Indent - You can create/remove hierarchical relationships between line items by using Indent or Outdent. Select the item you wish to move and choose Actions > Indent or Actions > Outdent (or right-click on the item and select an option from the context menu). Remember that the constraints of child items must match their parent's constraints. So if you select an item to indent, for example, and the Indent menu item is not active, then you are trying to build a parent-child relationship with items that have different constraints, which is not allowed. |
|
|
Delete - Deletes the selected field. Menu item available to users with Project > Delete > Financial Summary permission only. |
Adjusting Data Streams
There are three possible data streams that can inform a project's summary structure: Budget, Forecasts, Actuals (see What is a Data Stream?). Depending on how you (or your admin) set up the summary, you will see at the top of the summary at least one data stream, or perhaps all three data streams. The selected data stream(s) drive which Total columns to display.
You can choose on a project-by-project basis which of the available streams to actually display in the project's summary.
To add or remove a data stream:
- Go to the Actions menu and select Configure Settings.
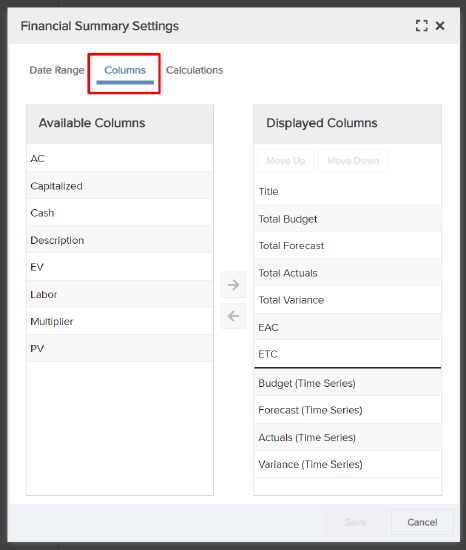
- In the configuration window, select the Columns tab.
- If you are adding a data stream, select it from the Available Columns and click the right arrow to add it to Displayed Columns.
- If you are removing a data stream select it from the Displayed Columns and click the left arrow to move it to Available Columns.
- Click Save.
The corresponding column, for each month and yearly/quarterly segment, will be added or hidden depending on your configuration (you might need to refresh your browser to see the updated summary). While hidden streams and any fields you defined for them are not visible, the system will still collects the values, and if you choose to reinstate a data stream, its values will be up-to-date.
Setting the Rollup Periods for the Summary (Configure Settings)
The Date Range tab of the Actions > Configure Settings dialog (see below) is where you configure the rollup periods for the project Summary data.
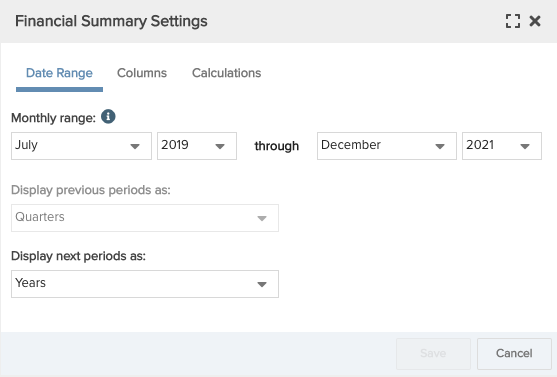
The Monthly Range is a period of time over which values are rolled up by month. Any fields you have configured to allow manual data entry will be editable within the monthly range (but not outside the range).
Display previous periods/Display next periods settings are where you choose the rollup period for data that falls outside of the monthly range. The periods - Years or Quarters - are limited by the months you choose for the monthly range.
- The monthly range must consist of whole quarters where the start date must be January, April, July, or October, and the end date must be March, June, September, or December.
- The Previous period can be years if your start date is January, otherwise it must be quarters.
- The Next period can be years if your end date is December, otherwise it must be quarters.
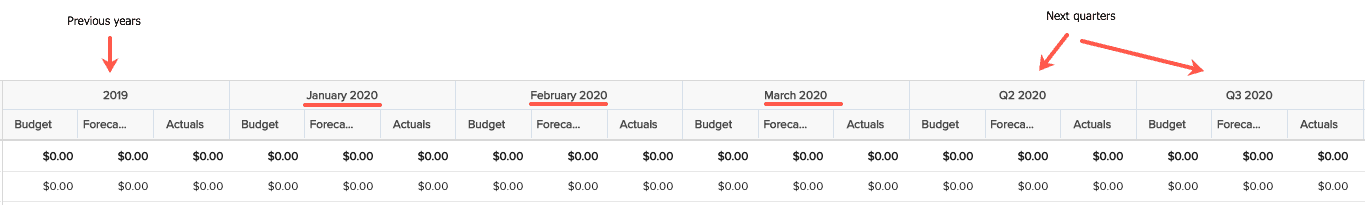
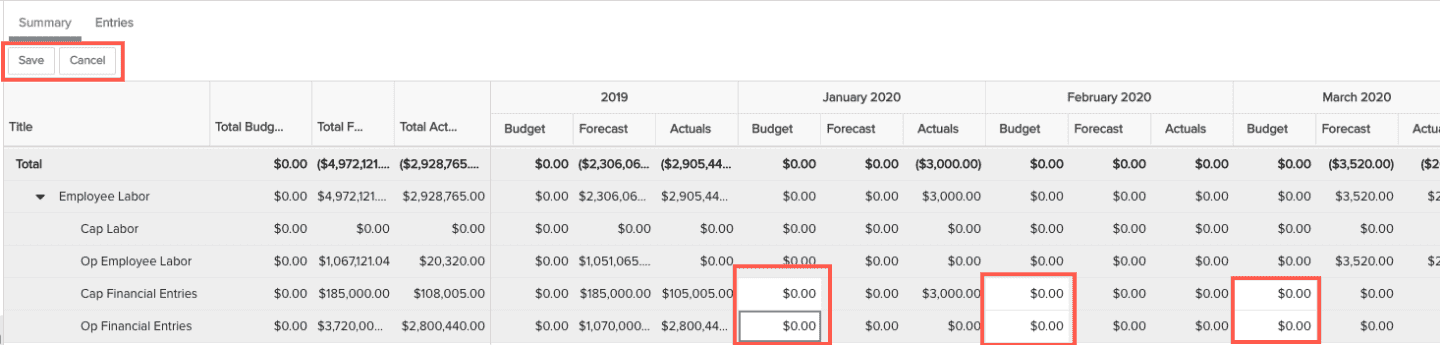
For example, in the following screenshot the monthly range is January 2020 - March 2020, the previous data is rolled by years, and the following values are rolled up by quarters.
The first time you open the Actions > Configure Settings dialog it will display a monthly range derived from the project's Start Date and Complete Date (or Target Date if no Complete date). If you notice that the dates in the dialog don't exactly match your project's Start/Target (Completion) dates, it's because the project dates fell mid-quarter and the system provided a default value of the first month of the quarter that contains the project's Start Date. Similarly, if the Target/Completion Date falls mid-quarter, the system will provide the value of the last month of the quarter.
You can adjust the values at any time. As you play around with the monthly range you might see the Next/Previous droplists become grayed out if you set the range in a way that prevents a whole year or quarter from preceding or following it.
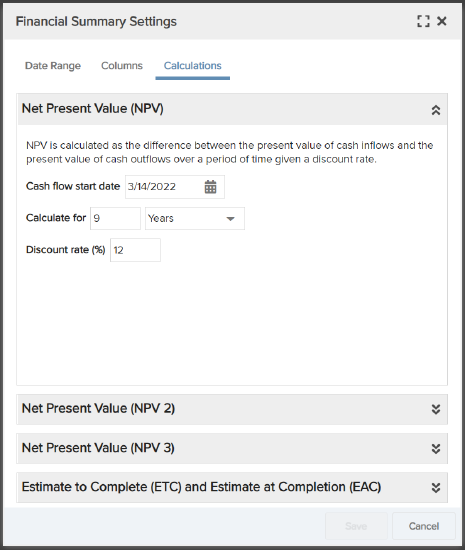
Calculation Details - NPV/ROI/ETA/EAC
When you first add a financial summary structure to a project, the summary respects the default calculation details that were set up globally (apply to all summaries) by your finance administrator. The global defaults are provided as a template - any changes made to the global defaults after you create a project's financial summary will affect subsequent summaries only, and will not change the settings on existing summary structures. You can override these settings on each/any project's financial summary.
The Calculations tab of the Actions > Configure Settings dialog (see below) is where you update for a specific project Summary the details for how to calculate ETA/EAC, as well as the parameters used for calculating NPV. The instructions for overriding are the same as for setting the defaults - see Setting Up Data Streams, Calculation Details for Financial Metrics.
Adding Items (Fields) to the Summary
Note: You must have Project > Edit > Financial Summary permission to view the Edit Structure menu.
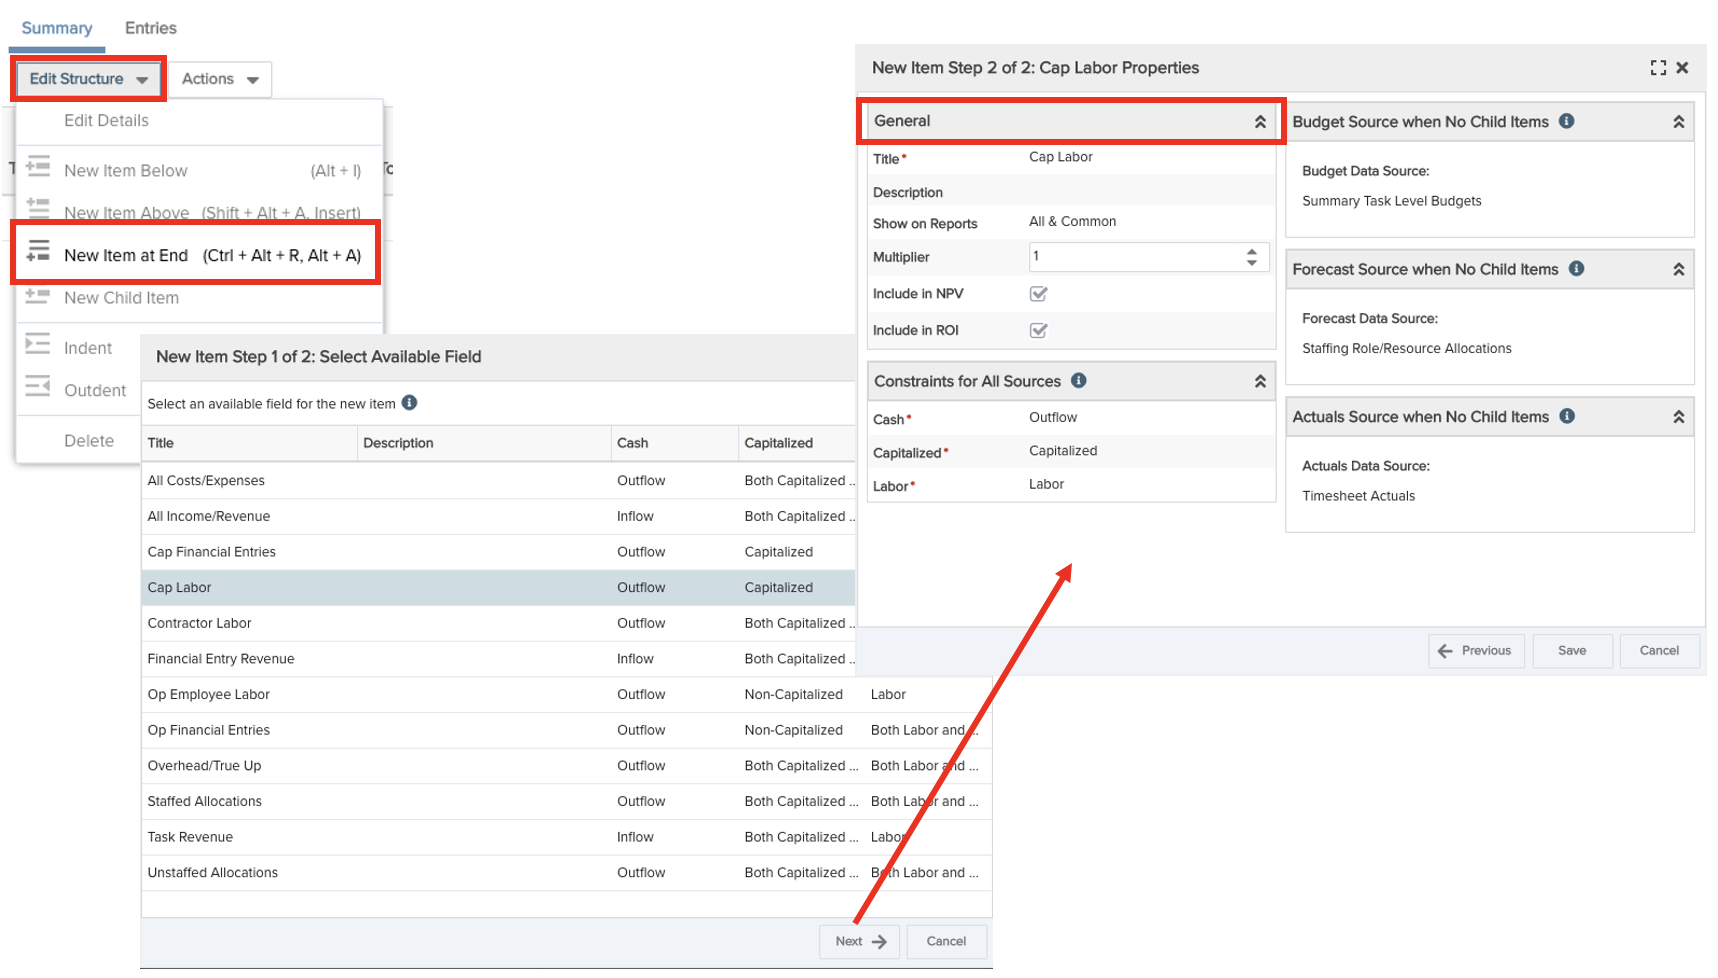
If you are adding the first field to the summary, simply choose Edit Structure > New Item at End (no other options will be active for the first field). More menu items will be available once there is a field on the summary. You add items to the summary by clicking New to invoke the New Item wizard. The wizard will always present all fields that are acceptable for that location in the summary, and that are not already on the summary.
For fields with child items, note that the child must be defined with the same constraints as its parent. For example, if you place the CapEx field on the summary, whose constraints are Outflow, Capitalized, Both Labor and Non-Labor), then any child of the CapEx item must have the same constraints. As a result, if you add a child item, the Available Fields dialog will appear and present only those fields who have the appropriate constraints.
The flow of adding a new field is shown below: Choose the appropriate New Item... menu item, select the desired field and click Next. The second page of the wizard shows the field's configuration. You can edit some minor properties in the General section, but otherwise the rest is informational. Click Previous if you want to select a different field. Once you are certain you want the field on the summary, click Save. (Hey, even if you're not certain, click Save anyway. You can always delete it.)
Since all summary fields are created at the Organization level and are available to all project summaries, you can freely build your structure from a common supply of fields knowing that they are standard across all projects. This ensures apples-to-apples comparison across projects. Conversely, if you have projects that have different financial rules, you can create fields in support of those rules, and adjust the data streams for certain projects. All the fields would be available at the Organization level, but used only when appropriate.
Reposition Fields
Use the Edit Structure > Indent or Edit Structure > Outdent menu items to create (or flatten) a hierarchy. For example, instead of adding a child item directly to the structure perhaps you added a bunch of fields all at the same level. You can then indent the appropriate fields to create a hierarchical relationship - provided the field has the same constraints as the parent field. Similarly you can flatten a parent-child relationship by outdenting a child field.
Remember that the constraints of child items must match their parent's constraints. So if you select an item to indent, for example, and the Indent menu item is not active, then you are trying to build a parent-child relationship with items that have different constraints, which is not allowed.
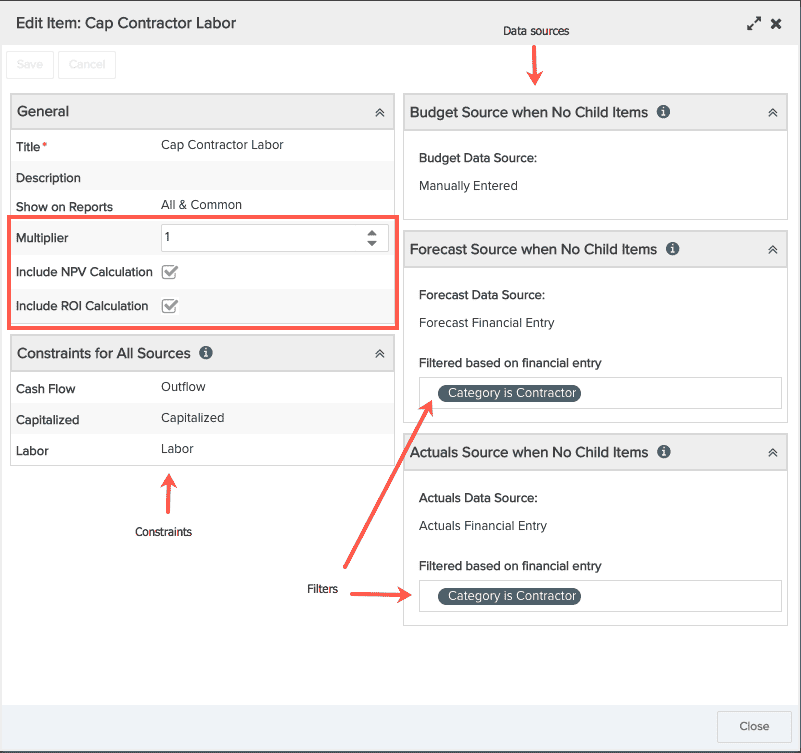
Viewing/Editing Field Details
Choose Edit Structure > Edit Details to view a modal that shows the configuration of the selected field. For example, imagine you select the Cap Financing field and then choose Edit Structure > Edit Detail - a modal like the one below appears. A few field properties can be edited here; one thing you can adjust is the multiplier (see Increasing/Decreasing the Effective Value of a Field) or whether to include the field in NPV or ROI calculations (supported in a future release). The rest of the properties are read only and provided for your reference. Any changes to fields other than the ones just mentioned must be made at the Organization level so that the fields are used consistently across projects.
Editing Fields Configured for Manual Data Entry
Click the Edit Values button located in the toolbar to put into edit mode any fields in the monthly range that have been configured for manual data entry. You can also right-click on the summary and choose Edit Values. In the screenshot below the fields highlighted with the red outline are all editable after clicking Edit Values. Notice also that the toolbar elements are replaced with Save/Cancel buttons, to accept or discard edits to the field(s).
Increasing/Decreasing the Effective Value of a Field (Multiplier)
The Multiplier field property allows you to increase or decrease the effective value of the financial data that feeds a specific field. "1" means the data is evaluated at face value. You can use "0" to allow the data to be represented in the summary but not rolled up in the data stream. Whatever value you see (right-click the field and choose Edit Details to see the value) is a default that you can adjust (provided you have Project > Edit > Financial Summary permission).
For example, you might have a field fed by a budget stream shared by two projects. You can include the field in the financial summary structure of each project, with a multiplier on the field of .5 - as a result, 50% of the budget will be included in each project.
Creating Project and Portfolio Rollups for Financial Summary Fields
Administrators and members of the Organization entity can create calculated fields at the Project and Portfolio level that will rollup all values from an individual Financial Summary field.
To create a Project-level calculated field to rollup values from a Financial Summary field:
- Under the Admin tab, create a Financial Summary filter for the field. Follow the instructions in Creating Filters to do this. Select Financial Summary as the filter entity.
TIP
For example, if you wanted to rollup values from a financial summary field called Capitalized Expenses, you can set up your filter criteria like this:
- Select Financial Summary as the filter entity.
- Select All of the following are true.
- Select Financial Summary: Title.
- Set the operator to is.
- Select Capitalized Expenses from the list.
- Switch to the Organization tab and create the calculated field using the Financial Summary filter you created. You can refer to formulas #24 (for Project-level fields) or #25 (for Portfolio-level fields) in the Calculated Fields Cookbook for examples. You can also refer to this guide for Creating Calculated Fields.
NOTE
When adding the Financial Summary filter to the calculated field formula, you have the option of using the filter's name or it's ID. Either will work, but using the filter ID will ensure the calculated field will continue to work if the filter is ever renamed.