
Printing and Exporting Dashboards and Reports
Anything that can be exported to Excel can also be exported with comma-separated values (CSV) or tab-separated values (TSV).
Exporting graphical reports results in a PDF document displayed in Adobe Acrobat Reader. Gantt charts are given a print dialog for configuring the list and graphical aspects separately. See Printing Gantt Reports to PDF below.
Printing/Exporting Dashboards
Dashboards and their components can be exported to Excel, PowerPoint and printed to PDF.
Options for dashboards
When exporting to Excel, each report on the dashboard is automatically exported into a separate worksheet. Also, when exporting dashboards with graphical report/chart components to Excel, the data behind the charts is exported as a list report - the visualization is not exported.
When exporting to PowerPoint, each report on the dashboard will be exported to its own slide.
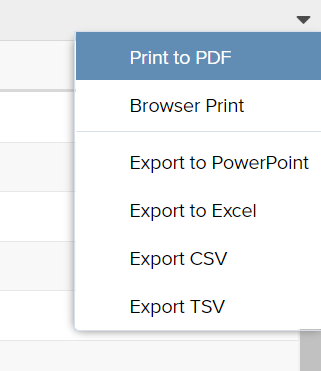
Print to PDF
When printing dashboards to PDF, each report in the dashboard is on a separate page. Use Browser Print (below) to print multiple reports on a page.
Browser Print to PDF
When printing from browser, the content will be adjusted based on different variables including page size, page breaks, white space, zoom percentage, and amount of columns in the report. While we attempt to maintain the best ratio possible, the browser will adjust as it sees best based on space constraint and the factors aforementioned.
NOTES
- For Gantt charts, you must select "print background colors" (each browser uses slightly different language) in order for the Gantt bars to display.
- For List reports, you can resize columns in the rendered report, and these changes will be reflected when you use the Browser Print option.
- For Crosstabs reports, browser print might present some issues, if needing to save a physical copy, we recommend publishing and downloading the dashboard to save.
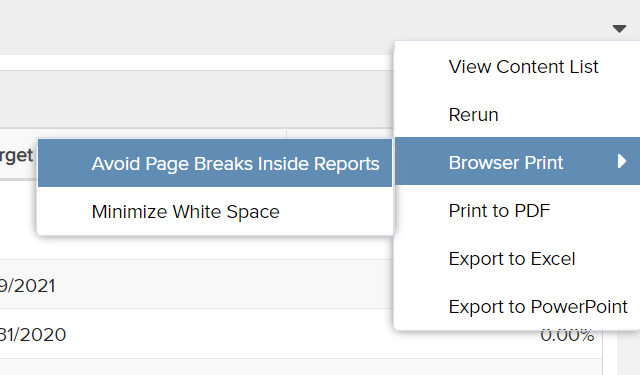
- Browser Print > Avoid Page Breaks Inside Reports - Prints as many reports as possible on one page, reports that don't fit on one page will start on a new page. For example if you have 2 charts and a list report, and the page break happens halfway through the list report, the list report will start on the next page.
- Browser Print > Minimize White Space - For example if you have 2 charts and a list report, and the page break happens halfway through the list report, half of the list report will be on the current page, and the other half of the list report will continue on the next page (or pages, if the list is long).
TIP
If the right side of the dashboard or report is cut off, try the following:
- make the browser narrower
- use a wider paper size
- use the chrome PDF option to zoom to less than 100%
Export to PowerPoint
When exporting a report, the entire report will be exported onto a single slide. When exporting a Dashboard, each report in the dashboard will be exported onto its own slide.
TIPS
-
Export to PowerPoint is WYSIWYG in nature and will fit each report to one slide.
-
When exporting a report to PowerPoint, the images in the Reports might be expanded to fit the PowerPoint slide vertically and cause distortion. Images can be resized after export in PowerPoint.
-
If you want to print/export and have your output match your rendered report exactly, we recommend that you print to PDF
Graphical Reports
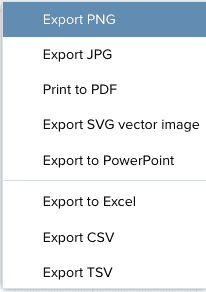
Graphical charts can be exported to Excel, PDF, and PowerPoint, as well to PNG or JPG files, and a SVG vector image. Note that when exporting graphical reports/charts to Excel, the data behind the chart is exported as a list report - the visualization is not exported..
Options for graphical reports
Text-based Reports (List, Crosstab, Gantt)
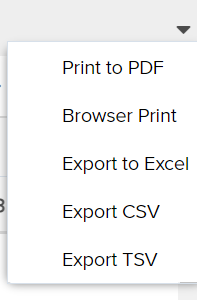
Non-graphical reports can be printed to PDF, and exported to Excel, PowerPoint, CSV and TSV files. See Printing Gantt Reports to PDF.
NOTE
When exporting report types such as List: Stacked and or lists with merged columns, the format in Excel will not match exactly the rendered format of the report. Folks generally export to Excel to perform further data manipulation, so we optimize the export to make the data easier to use. For example, repeating data that is supressed in the rendered report is displayed in the Excel export for easier manipulation; similarly, if columns are merged in a list report, the merge will be ignored for Excel/CSV export.
When exporting to PowerPoint, the entire report will be exported to one slide. This may cause scaling issues in the report.
If you want to print/export and have your output match your rendered report exactly, we recommend that you print to PDF.
Options for list-based reports
The Browser Print option for text-based reports is similar to the option for Dasboards but it does not have the additional options for controlling pagination.
TIP
- Unlike Dashboards, Browser Print for reports does not have a submenu of additional options.
- For List reports, you can resize columns in the rendered report, and these changes will be reflected when you use the Browser Print option.
- If the right side of the report is cut off, try the following:
- make the browser narrower
- use a wider paper size
- use the chrome PDF option to zoom to less than 100%
Printing Gantt Reports to PDF
- Run the Gantt report.
- In the Actions menu of the rendered report, choose Export/Print to PDF.
The dialog that appears includes 3 radio buttons, as shown in the screenshots below.
- The top button reflects the Topic entity on which the report is based. Select this radio button if you want to print the left-side columns as a list report only.
- Select the Gantt button to print the Gantt chart only.
- Select the List and Gantt Chart button to print both the list and the chart.
If printing the Gantt portion, select the date range you want to print; adjust the size and orientation as necessary.
|
Project Topic, Gantt Type
|
Task Topic, Gantt Type
|
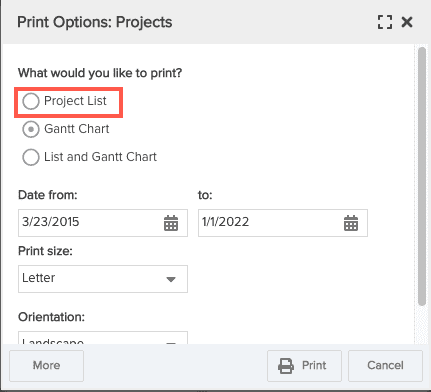
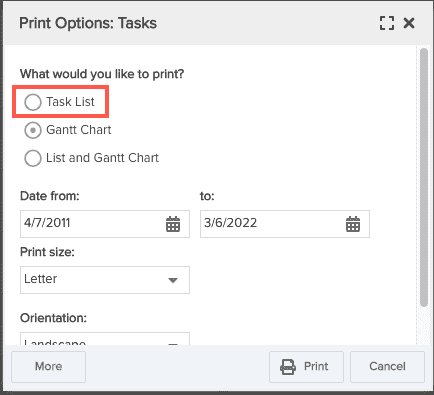
For additional options, click the More button and you will see options to:
- Show Header/Show Footer
- Print list/chart on one page (shrinking list as necessary)
- Print Gantt Bar labels
- Print columns: select the columns you wish to include in the list part of the report.
Browser Print for the Gantt Report
- Run the Gantt report.
- In the Actions menu of the rendered report, choose Browser Print.
NOTES
For Gantt charts, you must select "print background colors" (each browser uses slightly different language) in order for the Gantt bars to display.