Configure Key Performance Indicator (KPI) Trend Reports
PPM Pro's KPI trend reports allow you to report on a set of data over a specific time period at a set frequency. KPI trend reports are useful, for example, for tracking:
- investment against potential revenue - and how it is trending per month - to determine if a new product is worth the effort
- how average operating costs trend over a year, for example, to understand and monitor performance
- a project's actual completion is trending against the planned completion, to ensure the project is on track
Currently, list and simple column chart report output types are supported.
Before running KPI trend reports, be sure to configure PPM Pro to collect the trend data on which to report - portfolio and project fields are currently supported. If you want to report on the last six month's of data for projects, for example, be sure to configure the fields to collect for at least six months prior to running the report. See How to Set Up KPI Trend Fields for Data Collection.
Please Note
- Data will not be available immediately when you configure a trend report - need to collect data for at least one week before it is available for reporting.
- When you add a new trend field for data collection, you won't see past data when you add these new fields to a report - need to collect data for at least one week.
- Snapshots are taken on all projects with status of implied open or proposed (snapshots not taken on projects with status of implied closed).
- If using the multi-currency feature, monetary fields captured for a project that uses a different currency than the Organization currency are converted to the Organization currency. KPI reports will use the Organization currency.
- Sorting is not available for KPI trend reports.
- Trend fields cannot be aggregated. The user interface does not prevent you from picking an aggregation function, but the resulting values will be inaccurate.
- Trend fields cannot be used in column charts for the Data Series fields (Y-axis)
- Trend fields cannot be used as filter fields. For example, if you have configured Risk to be a trend field, you cannot create a report that returns only records where Risk = Medium.
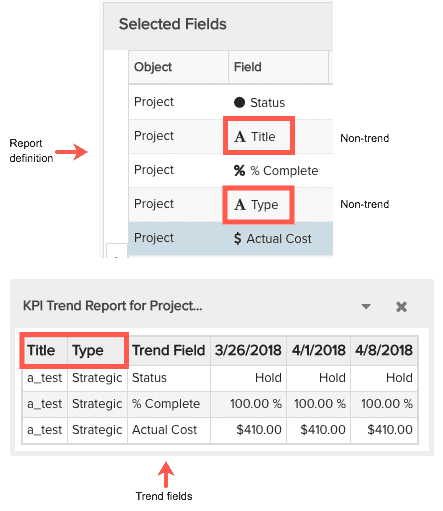
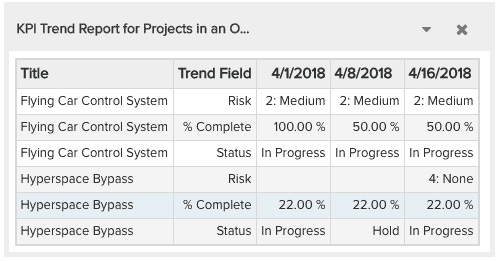
- If you mix trend fields and non-trend fields in the same report, the non-trend fields will appear first (starting from the left), and then the trend field values will come after and will be listed vertically:
KPI Trend Report Sources
You can run KPI trend reports on projects and portfolios. Report sources are available for the following targets, in the pattern: "KPI trend report for <entities> in a <target>". For example, "KPI Trend report for Projects in a Organization"
The following targets and categories are supported:
| Target | Category | Report Sources |
|---|---|---|
|
Project |
|
|
Portfolio |
|
Output Options
Trend field reports support list and simple column chart output types. Note the following:
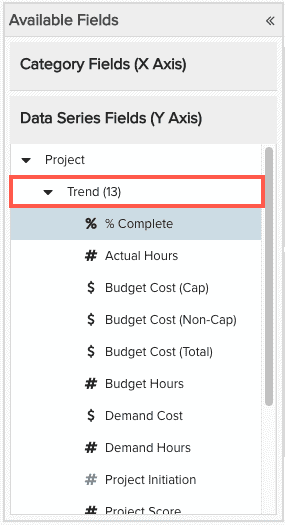
- For simple column charts,
- the Category Fields (X-Axis) folder shows the primary entities metadata - not the KPI trend fields. You pick one of the fields to group on.
- the Data Series Fields (Y-Axis) folder allows you to pick the one of the numeric fields that you have been trending on (Demand Cost, Actual Cost etc.). Column charts only chart changes to numeric fields.
- Drilldowns to list reports are supported for both output types.
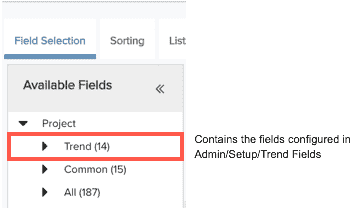
Available Fields
There is a Trend fields folder in addition to the Common and Related fields folders that is available for all report sources (and just for the Data Series fields for simple Column charts). The Trend folder contains the fields configured in Admin/Setup/Trend Fields. This Trend folder is provided as a convenience to group all of the trend fields together; the trend fields will also appear in Common (if appropriate) and All folders, but will still be treated as trend fields (until/unless they are removed from the data collection UI).
The screen below is an example for list report output:
The screen below is for simple Column chart output:
Note that if a field was configured for data collection (and thus appeared in the Available Fields/Trend folder) and then is removed, the field will also be removed from the Trend folder. Any reports created prior to removing the field will still show the snapshotted values, but will not show values going forward.
Runtime Options
There are a set of options that are presented when running a KPI trend report. These options allow you to configure the interval over which to report on, as well as the frequency with which to report the value. The options you configure are sticky (persisted) between report runs. All options are described below.
| Runtime Option | Description |
|---|---|
| Filter | Optional filter for narrowing your report data. |
| Target | Select a specific instance of the target entity. |
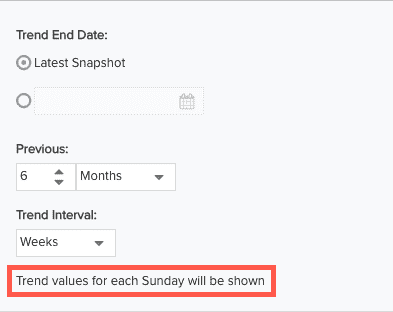
| Trend End Date |
Latest Snapshot - This is the default. Trend data will include the latest snapshot date prior to the current date (includes the current date if it is a snapshot date). (Date field, no label) - Trend data will include the latest snapshot date prior to the date entered (includes the date entered if it is a snapshot date). |
| Previous | Sets the reporting period starting from the Trend End Date and going back the specified number of periods (number of weeks, months, quarters, or years) |
| Trend Interval | Controls the reporting interval for the trend data: weeks, months, quarters, years. |
Note that the description at the bottom of the runtime options dialog reflects your settings. For example, the data collection period goes back 6 months, but the values will be shown in weekly intervals:
Creating a KPI Trend Report
These instructions assume you have been collecting data for project KPI trend fields Status, % Complete, and Actual Hours.
- Navigate to Reports and click New.
- Select a report source - for this example we'll use Target = Organization, Category = Project, report source: KPI Trend Reports for Projects in an Organization.
- Click the Output Options tab and select the List output type.
- In the Available Fields list, you'll see the folders Trend, Common, All.
- Open Trends folder and drag the Status, % Complete, and Actual Hours fields folder over the Selected Fields section.
- Open the All folder and move the Title field over and move it to the top of the Selected Fields section.
- Click Save and Run.
- In the Set Filters dialog:
- Trend End Date: leave Current Date.
- Previous: enter 6 months
- Trend Interval: select Weeks
- Click Run.
Sample list report output:
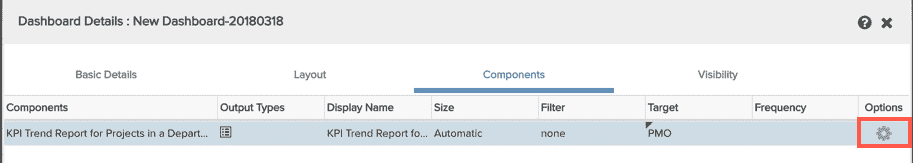
KPI Trend Reports and Dashboards
You can include a KPI trend report in a dashboard. After adding the report, go to the Components tab and click the gear icon. This will bring up the Runtime Option dialog described above. Note that you can configure the Filter (optional) and Target fields either in the Options dialog or on the Components grid.