Exporting report data
All custom reports can be exported to the following file formats:
-
CSV
-
Excel
Note: Gantt charts can be exported to PDF.
When you export to CSV or Excel, you are presented with a standard File Download dialog, where you can export and open the file, or save the file. If you click Save you can browse to your desired location. The download dialog might work differently depending on the browser you are using. If you export the file and the File Download dialog does not display, check your browser settings - you may need to enable Active X controls.
There are subtle differences in the results of an export depending on a report's characteristics and the export technique.
This topic covers the following:
- General Notes about Exporting to CSV
- Handling special characters when exporting to Excel
- Exporting Chart Data
- Exporting Report Data
- List Report
- List Report with Hidden Details
- Crosstab Report
- Exporting Capacity and Demand Screen Data
General Notes about Exporting to CSV
Data exported to CSV results in tabular data - no formatting, no subtotals - displayed in Excel. Typically, CSV file extensions will open in MS Excel on your desktop.
Text Formatting When Exporting to Excel
When content you entered in a rich text editor is exported to Excel, line and paragraph breaks are preserved (paragraph breaks are converted to line breaks), and bullet points are preserved. All other text formatting is removed.
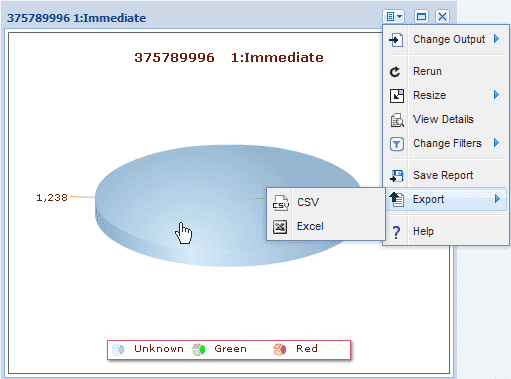
For an individual chart you can export data to CSV or Excel.
Exporting Chart Data
CSV/Excel Export
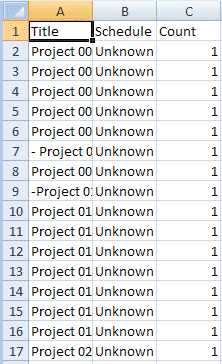
You can export detailed data behind the chart using the Excel or CSV options from the Export Data menu choice.
CSV data dump opened in MS Excel is displayed below.
Data exported to Excel is shown in the screenshot below.
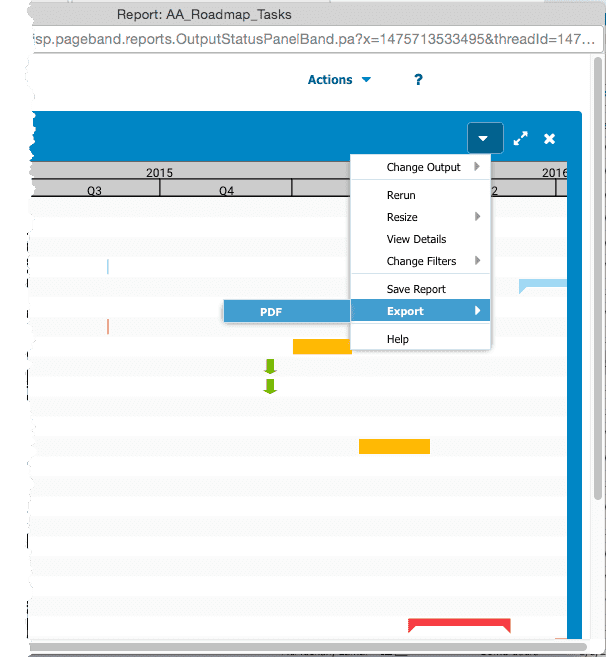
For individual reports - all output types except GANTT charts - you can export data to CSV or Excel.
Gantt charts can be exported to PDF.
Exporting Report Data
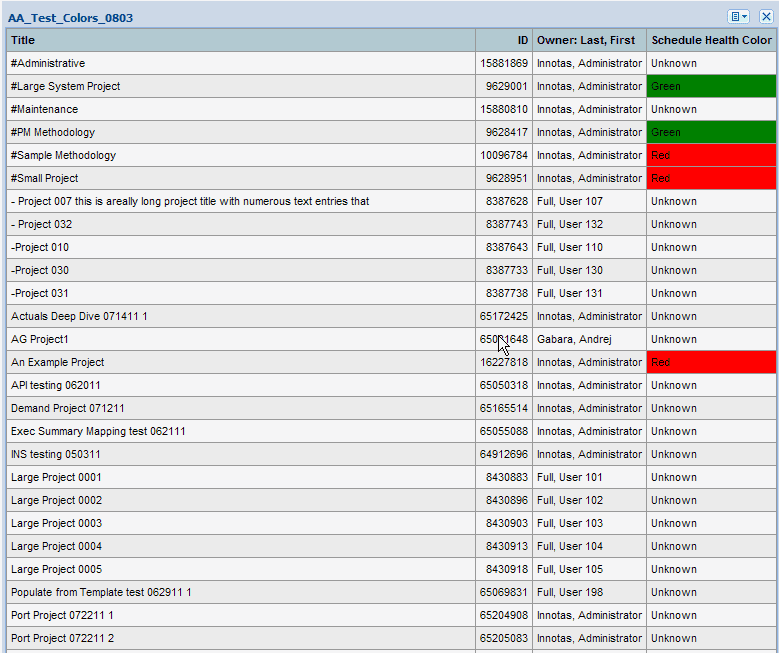
List Report
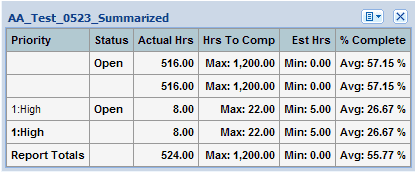
List report output is displayed below. This sample list report has subtotals and one column with Red, Yellow, Green colors.
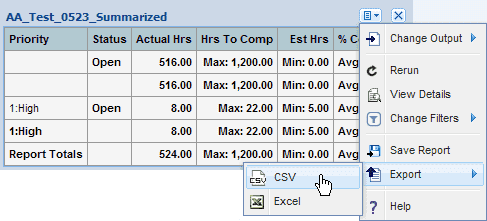
CSV Export
Choose Export > CSV.
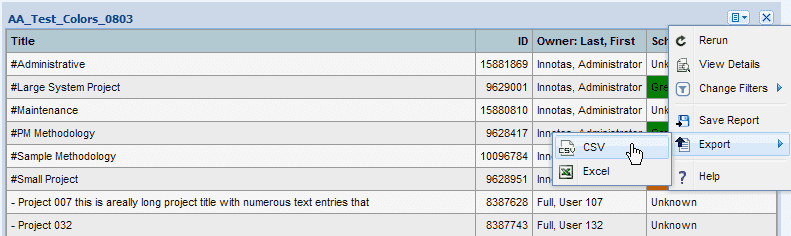
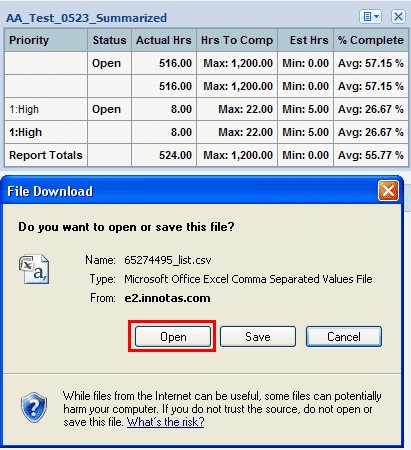
On the File Download dialog click on the Open button.
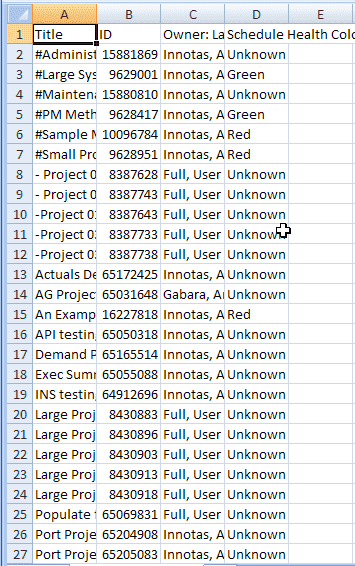
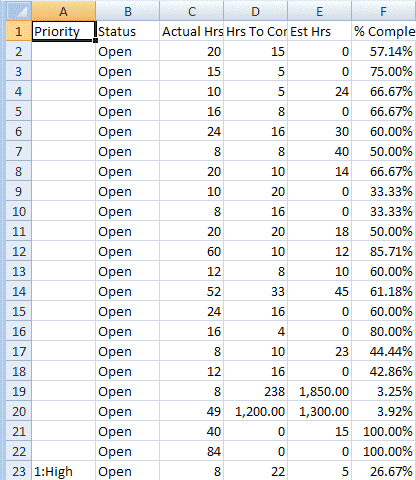
The screenshot below shows the list report CSV file opened in MS Excel.
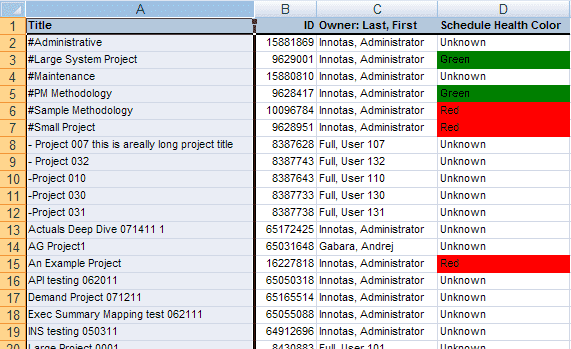
Export to Excel
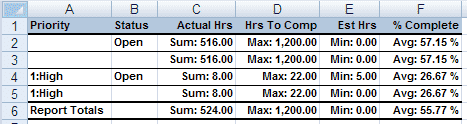
The screenshot below shows the list report exported to Excel.
List Report (Hidden Details)
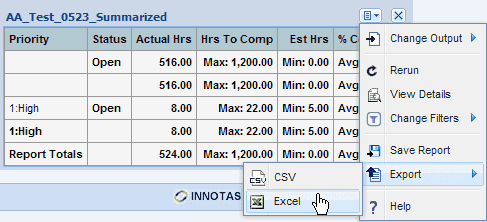
If you created a report and chose the Hide Details option, the report renders only the data you left unhidden, as shown in the screenshot below. To export the data exactly as rendered, choose Export Data > Excel. If you wish to export the hidden data as well, choose Export Data > CSV.
A summarized list report with hidden details is displayed below.
CSV Export
Select Export > CSV.
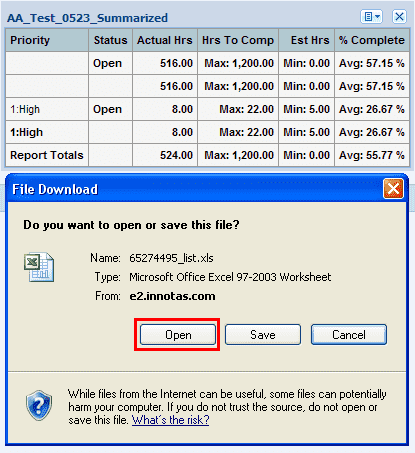
Click “Open” on the “File Download” dialog.
For a list report run with “Hide Details” option, detail data is not exported to CSV. Since the report has only summary data and details are hidden, no data is exported to CSV.
Export to MS Excel
Select Export > Excel.
Click “Open” on the “File Download” dialog.
For a list report run with “Hide Details” option, detail data is not exported to Excel.
Exporting Crosstab Reports to Excel
When you export crosstab output to MS Excel, Excel macros are created automatically to create a pivot table and pivot chart.
When the downloaded MS Excel file opens, you are prompted to enable macros if they are not already enabled. Again, you need to macros to generate the pivot table and chart. In addition, be sure to enable editing and enable content, as shown below:
![]()
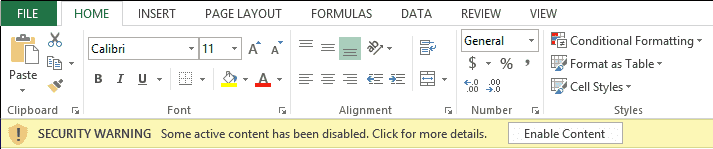
You can also explicitly enable/disable macros by choosing Excel Options >> Trust Center >> Trust Center Settings >> Macro Settings.
Supported Windows/MS Office combinations for crosstab export to MS Excel
-
Windows 7/Office 2007, 2010, 2013
-
Windows 8/Office 2007, 2010, 2013
Not Supported
-
Windows 7/Office 2003
-
Windows Vista
-
Windows XP
-
Mac OS
Exporting Capacity and Demand Screen Data
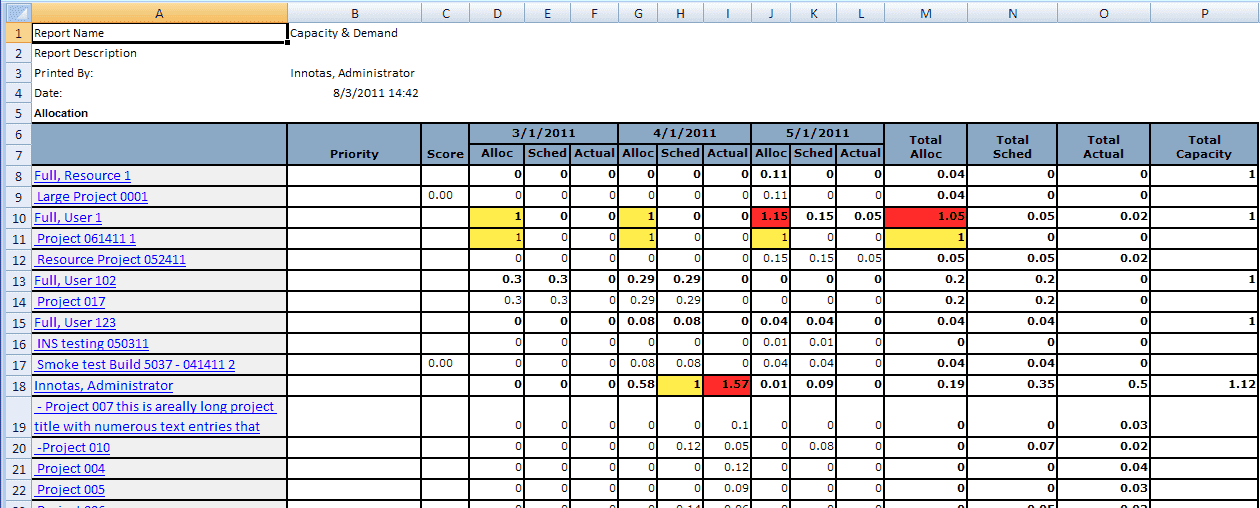
Data displayed on Capacity and Demand screens also can be exported to MS Excel. From the Capacity & Demand screen, click Print.
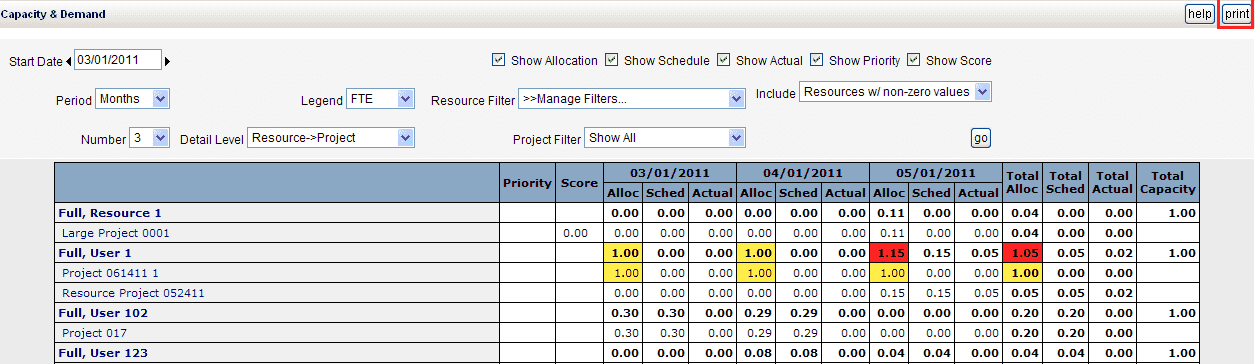
From the rendered report, select Export > HTML to Excel. You will be prompted to Open or Save the Excel file.
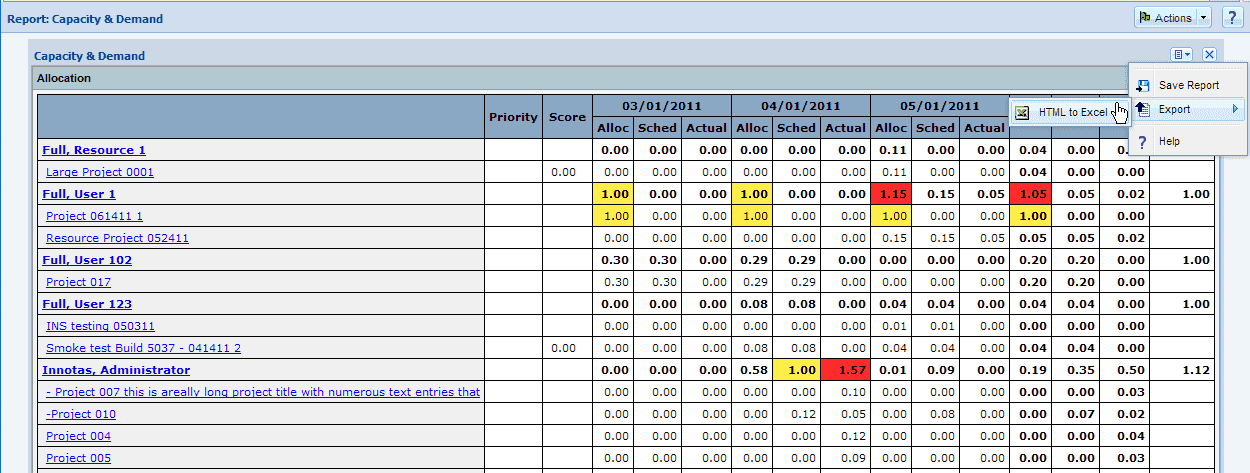
Below is the output in Excel: