
Scope Tab
Once you have dropped some reports into a dashboard, you use the Scope tab to determine the potential data set/scope for a dashboard. The scope - or the context in which a dashboard is run - is influenced by where you can execute the dashboard, as well as whether the user running the dashboard has been allowed to rerun a dashboard over a different set of data. Finally, the Scope tab section "Allow access on these sections" is where you determine which dashboards can be viewed in Home/Overview and/or project/Overview.
See also Configuring Filters and Time Series Settings for Dashboard Report Components, which is tab-independent as it is configured on each report component in the Preview Pane.
You can move to any of the other tabs by clicking Content, Display, Team. See also Using the Dashboard Designer for general information about the dashboard designer.
Allow access on dashboard grids
Dashboards can be configured to be able to be run from the Dashboard list of any of the following entities: project, portfolio, resource, division, department, organization. Those lists are generically referred to as "entity-level Dashboard lists" and must be provisioned manually. Dashboards can also be run from the main Dashboards list that you access from the top-level Dashboard navigation icon ("top-level Dashboard list") - no provisioning required, dashboards automatically shown on that grid. It is important to understand the implications of running from one grid or another:
Where a dashboard is run provides the default context, or "scope" of the data on which it will run. For example:
- a dashboard run from the project Dashboards list is automatically scoped to the current project.
- a dashboard run from a portfolio Dashboards list is automatically scoped to the current portfolio.
- a dashboard run from the top-level Dashboards list is automatically scoped across the entire data set. Note that the top-level Dashboards list and the Organization entity-level Dashboards list share the same scope (entire data set).
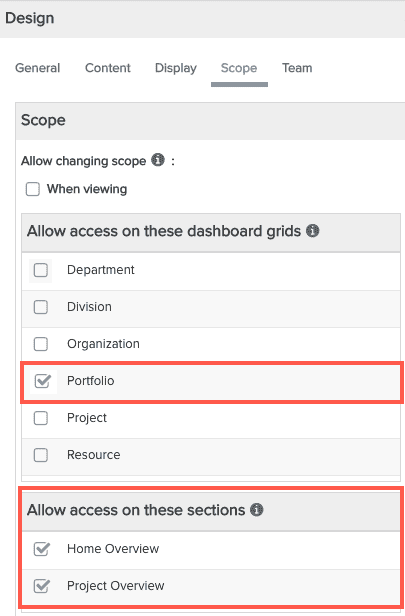
You grant dashboard access from the entity-level dashboard grids by checking the box next to each entity you want the dashboard accessible - see screenshot #1 below. All dashboards can be accessed from the top-level Dashboards grid by default, so there is no configuration option for that dashboard. Note that checking the box makes the dashboard available on an entity grid, the dashboard consumer still needs to navigate to that grid and execute the dashboard from there in order to scope the results to that context/data set.
Also depicted in #1 below is where you configure whether a dashboard can be used in either of two special sections - Home Overview and Project Overview. See Setting Up Overview Dashboards
|
#1. Select the entity dashboard grid - in the example it is Portfolio. In addition, decide whether to allow the dashboard to be used on Home Overview and/or project Overview. You can configure these settings the same time you are selecting the dashboard grid in #1, or add them later. See Setting Up Overview Dashboards, which describes in detail what happens when you select either of the options below.
|
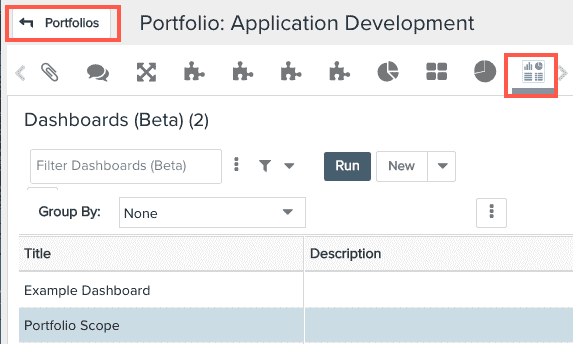
2. Dashboard appears on Dashboards grid of any portfolio, such as Portfolio: Application Development shown below. |
|
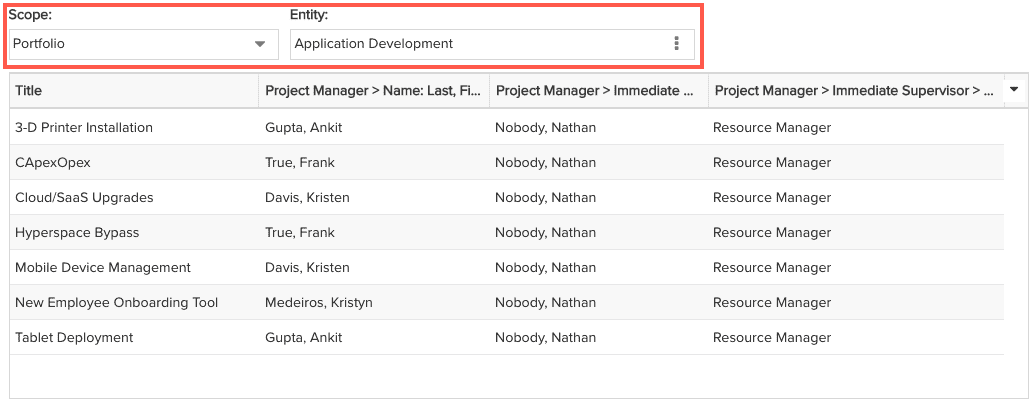
3. The dashboard results will be scoped to that specific portfolio; user can have the option to select a different entity instance or different entity altogether, provided the dashboard is configured to allow changing scope. In the screenshot below, the dashboard is scoped to the Application Development portfolio - the user can select a different portfolio.
|
|
Allow Changing Scope when Viewing Dashboard
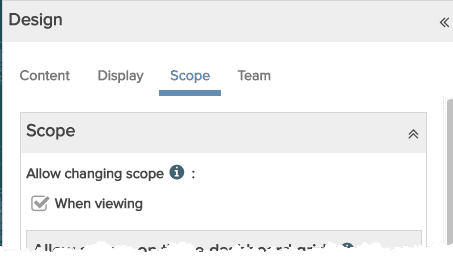
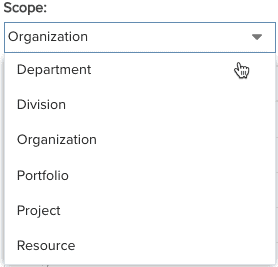
Running a dashboard from an entity-level Dashboards list is one way to automatically scope a dashboard. Additionally, you can grant users the ability to change the scope (context in which the dashboard is run) when viewing the dashboard. You grant this ability by enabling the setting "Allow changing scope" that appears near the top of the Scopes tab. When you enable this setting for a dashboard, the user running the dashboard will see a Scope droplist on the rendered dashboard - the user can simply choose a scope and the dashboard will be re-run on the selected data set. The setting and the Scope menu are shown below.
|
1. Enable "Allow changing scope" setting to make the Scope menu available, then Save & Run the dashboard.
|
2. Choose a different scope. If you choose any entity other than Organization, an Entity menu also appears
|
3. Run the dashboard to limit the scope to one specific entity instance.
|

Please note: When a dashboard is run from the top-level Dashboards list, it is run across data from the entire organization. You do not need a scope to do this, simply run the dashboard from the top-level Dashboards list. However, it is useful to allow changing the scope if you want users to be able to easily run an organization-wide dashboard from any level, not just from the top-level Dashboards list.