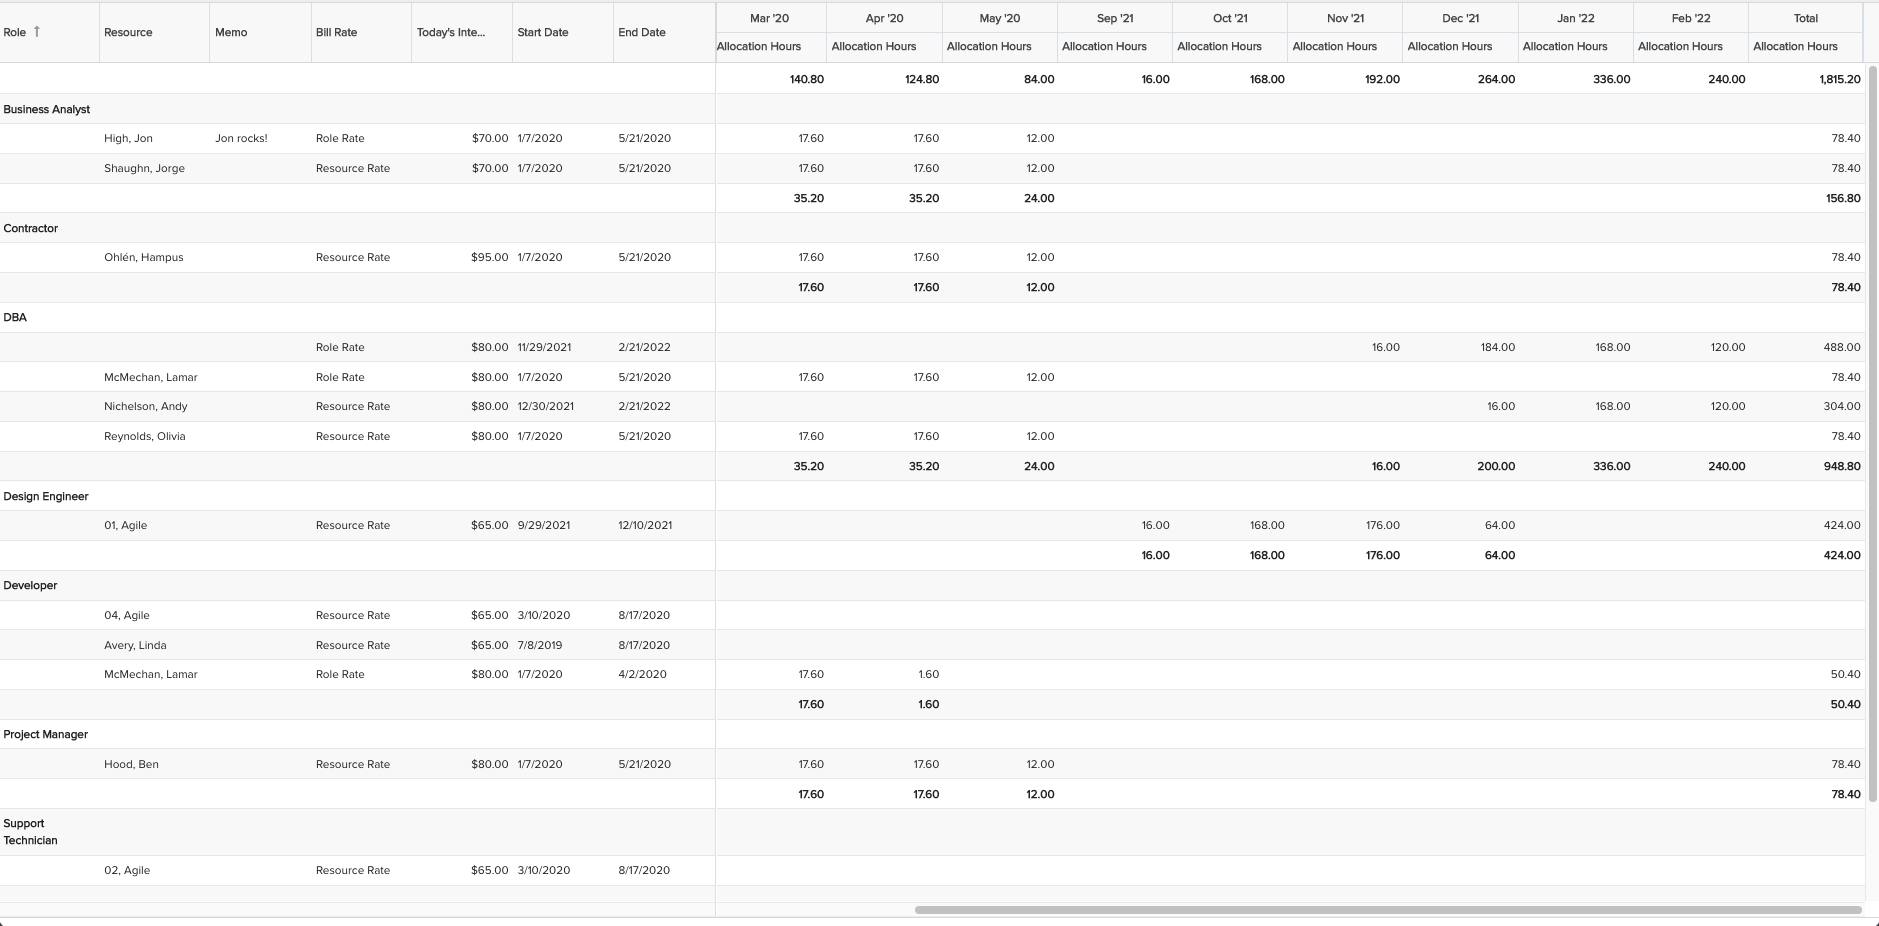
Project Staffing
Displays resource allocations on a project, mimicking the Project/Staffing Grouped view. The primary differences between this report and Staffing are that the allocation totals are at the top rather than the bottom and the Total allocations column is to the far right. You can build this report using the design settings in the table below. Alternatively, you can download this report definition and upload it to your PPM Pro instance.
| Design View | Selection | Comments |
|---|---|---|
| General |
Topic: Allocated Role Specialty: Time Series Type: List: Time Series Title: <enter a meaningful title>
|
|
| Data |
List Fields: Add whichever of the following Allocated Role and other fields that would be of value and/or match the Project/Staffing view's columns, such as:
Time Series Fields: Only available fields that have a time series indicator appended to their titles - such as '(Time Series)' - should be added to this section (hint: search Available Fields list for 'time series'). From the Allocated Role available fields add the following:
|
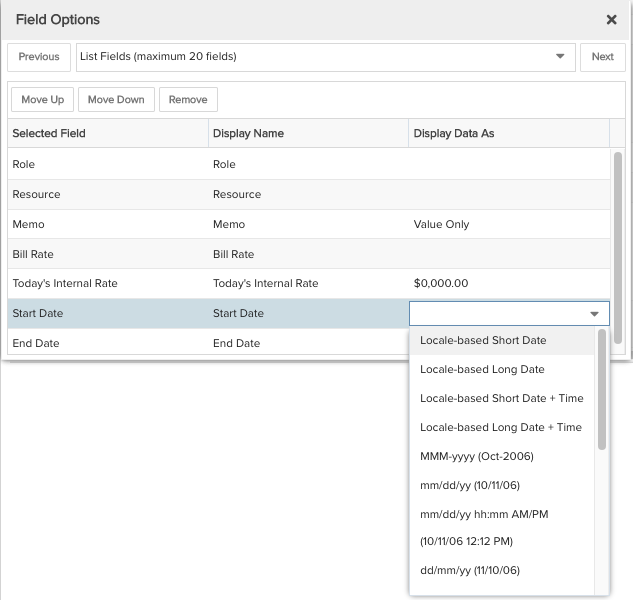
NOTE: If you are using this report for a single project, for example to be run from a project's report grid or to be included on a project status dashboard, you do not need to include the "Project" field. However, if you will be running this report across a portfolio of projects, you will likely want to include the "Project" field first/before "Role". To change the field Display Names, within the List Fields area select the edit icon for "Show Field Options" and in the resulting "Field Options" modal, edit the Display Name. You can also change the Display Data As format options for various fields in this modal.
|
| Display |
Configure desired options within the Display tab, such as:
|
If you prefer the Project/Staffing List view, do not use "Group and total" for the "Role" field in Sorting. If you will be running this report across a portfolio of projects, you will likely want to make the Sorting Priority 1 field "Project" with Group By "Group". |
| Variable Settings |
Scope: Project, so that the report will appear in the Project/Reports grids Filters: Any allocated role filters Time Series: Select a Frequency and Date Range appropriate to your report needs, such as:
|
If you would like to allow changing Filters or the Time Series selections before running the report or when viewing the report, select the 'Allow changing' checkbox options for each. |