Dashboards Cookbook
The purpose of this topic is to provide an example set of dashboards and steps to configure them (recipes) within the dashboards, so that you can get a feel for the possible and also backwards engineer various dashboards. If you have any questions about any of the following or other dashboard needs not addressed here, are looking for a specific recipe that has not yet been included, or have a recipe you would like to share, please contact productmanagement-ppmpro@planview.com.
Dashboard Recipes
| # | Sample Visualization | Dashboard |
|---|---|---|
| 1 |
|
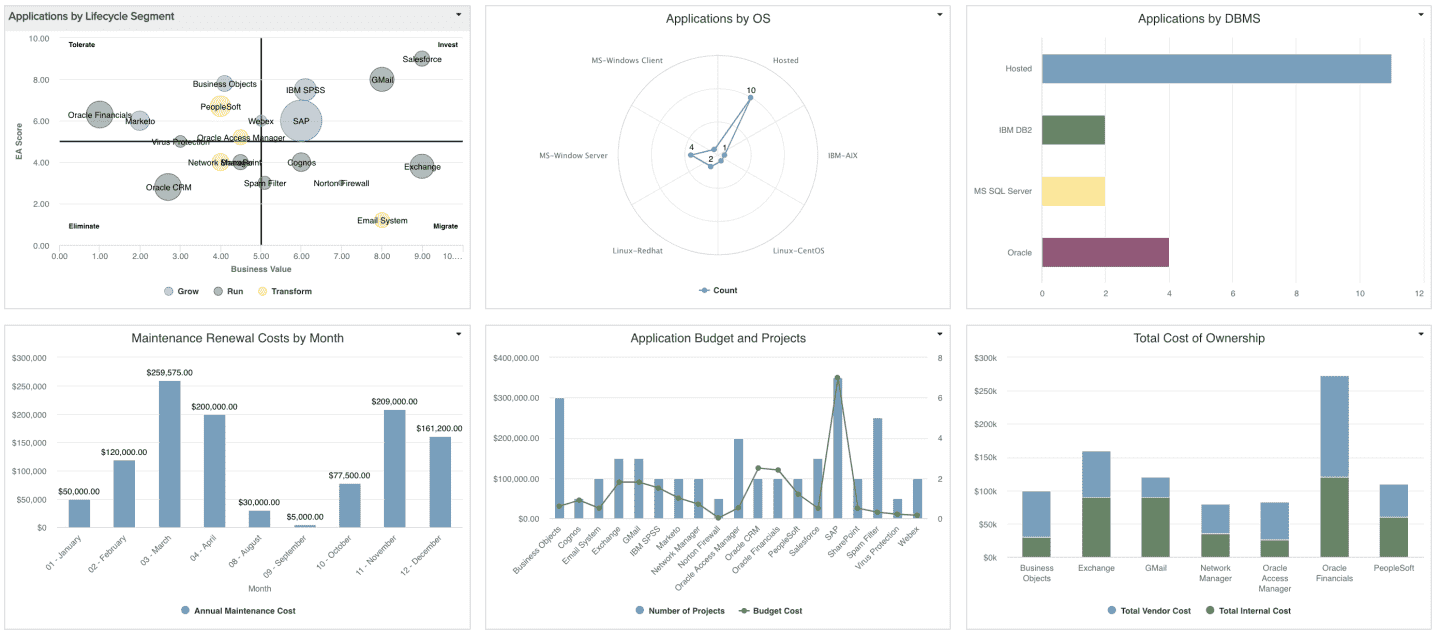
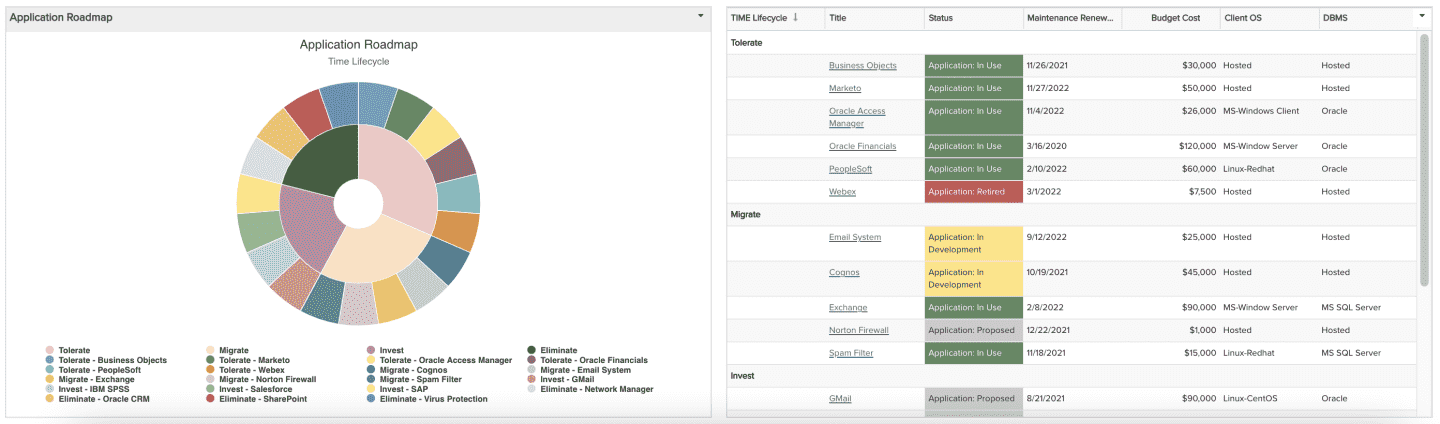
Application Portfolio Management Dashboard - Overview of applications by life cycle, operating system, data base management system, maintenance renewal costs by month, budget cost and project, total cost of ownership, and application roadmap |
| 2 | 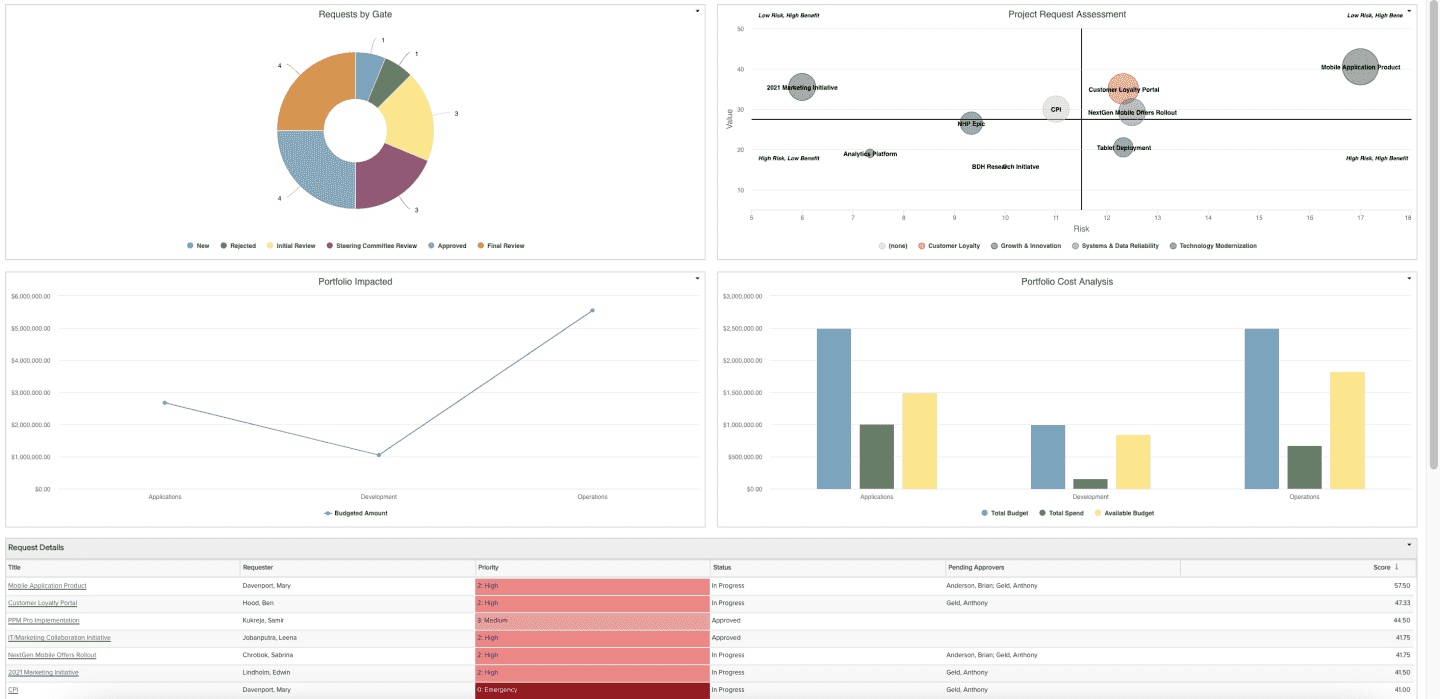 |
Demand Management Dashboard - Summary of requested project and other work, including requests by gate, risk versus value, portfolios impacted, portfolio cost analysis, and request detail |
| 3 | 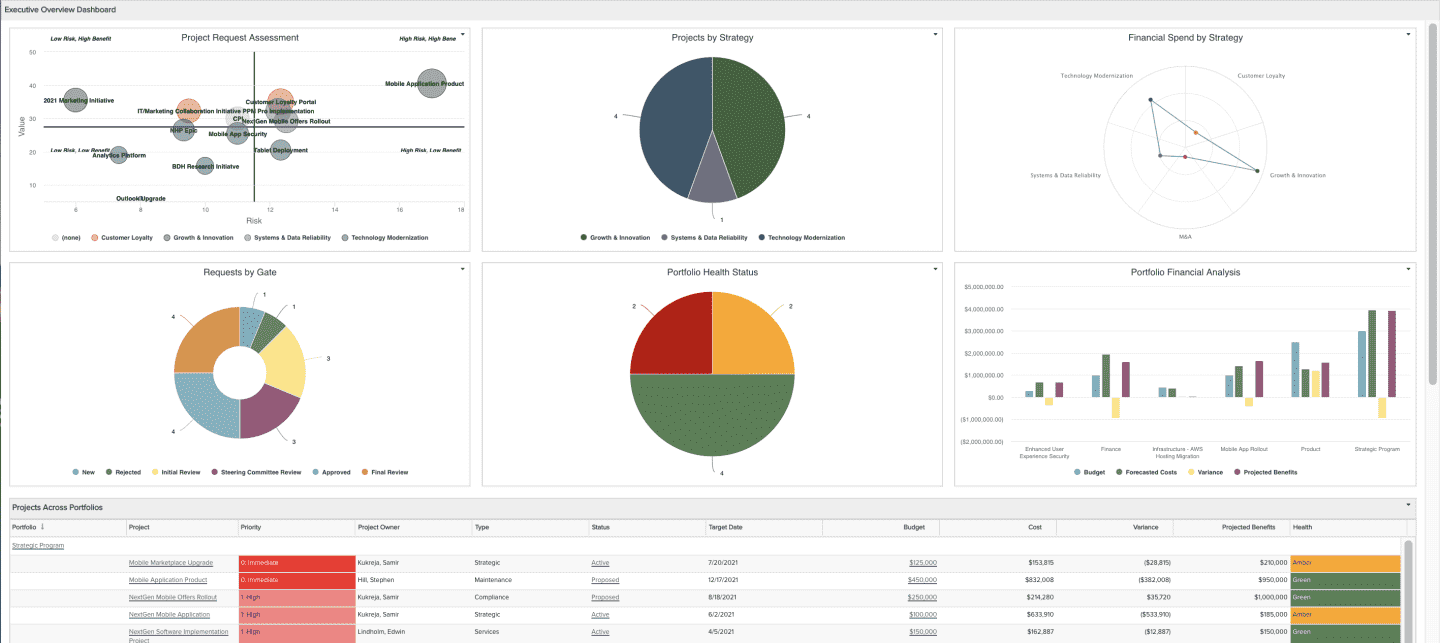 |
Executive Overview Dashboard - Summary demonstrating requested work flowing through the organization, project and financial alignment to strategic objectives, project health status, portfolio financial status, and portfolio work details and progress |
| 4 |
|
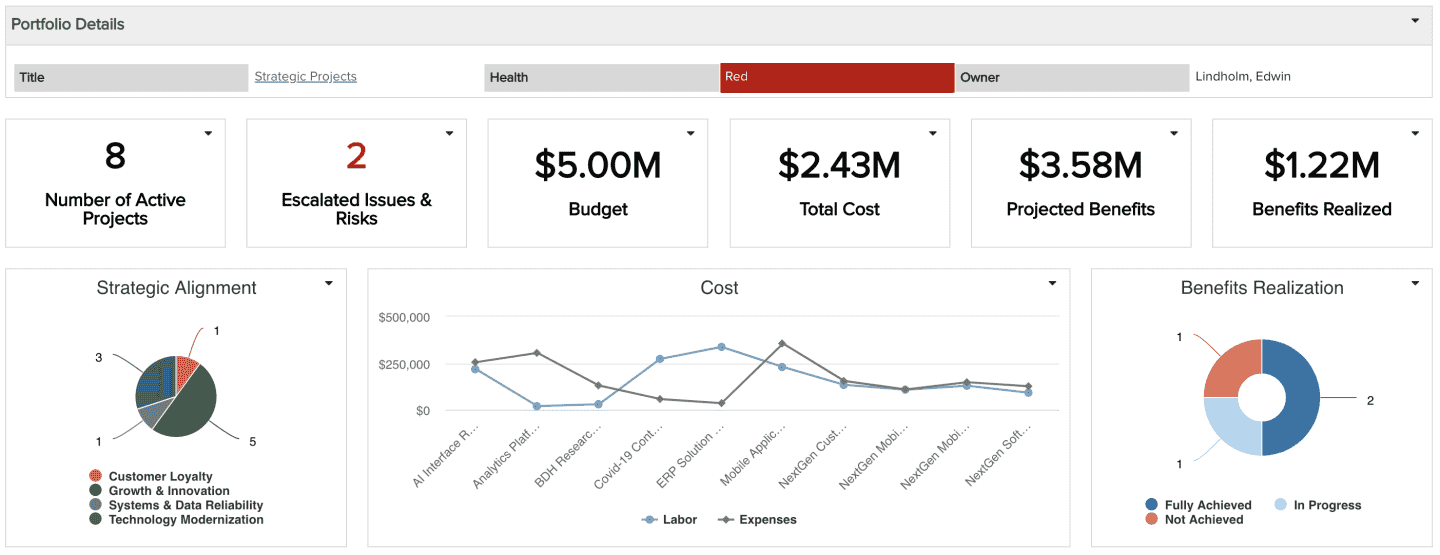
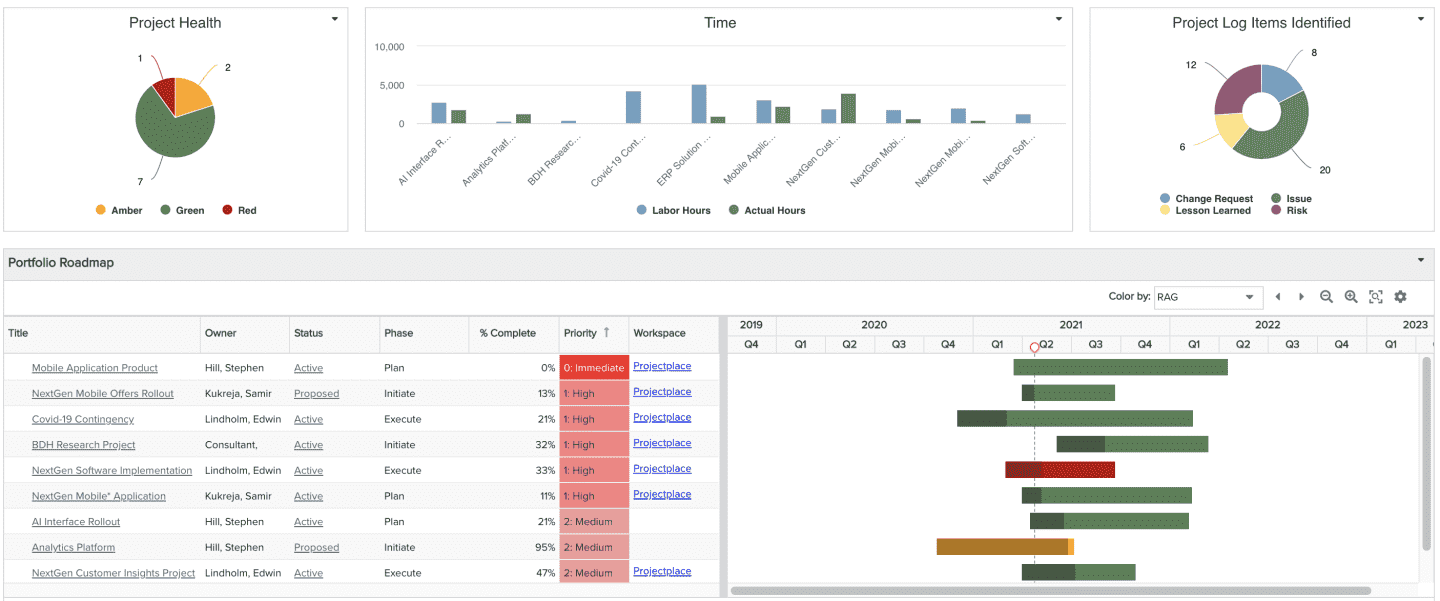
Portfolio Overview Dashboard - Summary of key portfolio, program, and project data, including portfolio strategic alignment, project health, labor vs. non-labor cost and hours, benefits realized, project log breakdown, and portfolio roadmap |
| 5 | 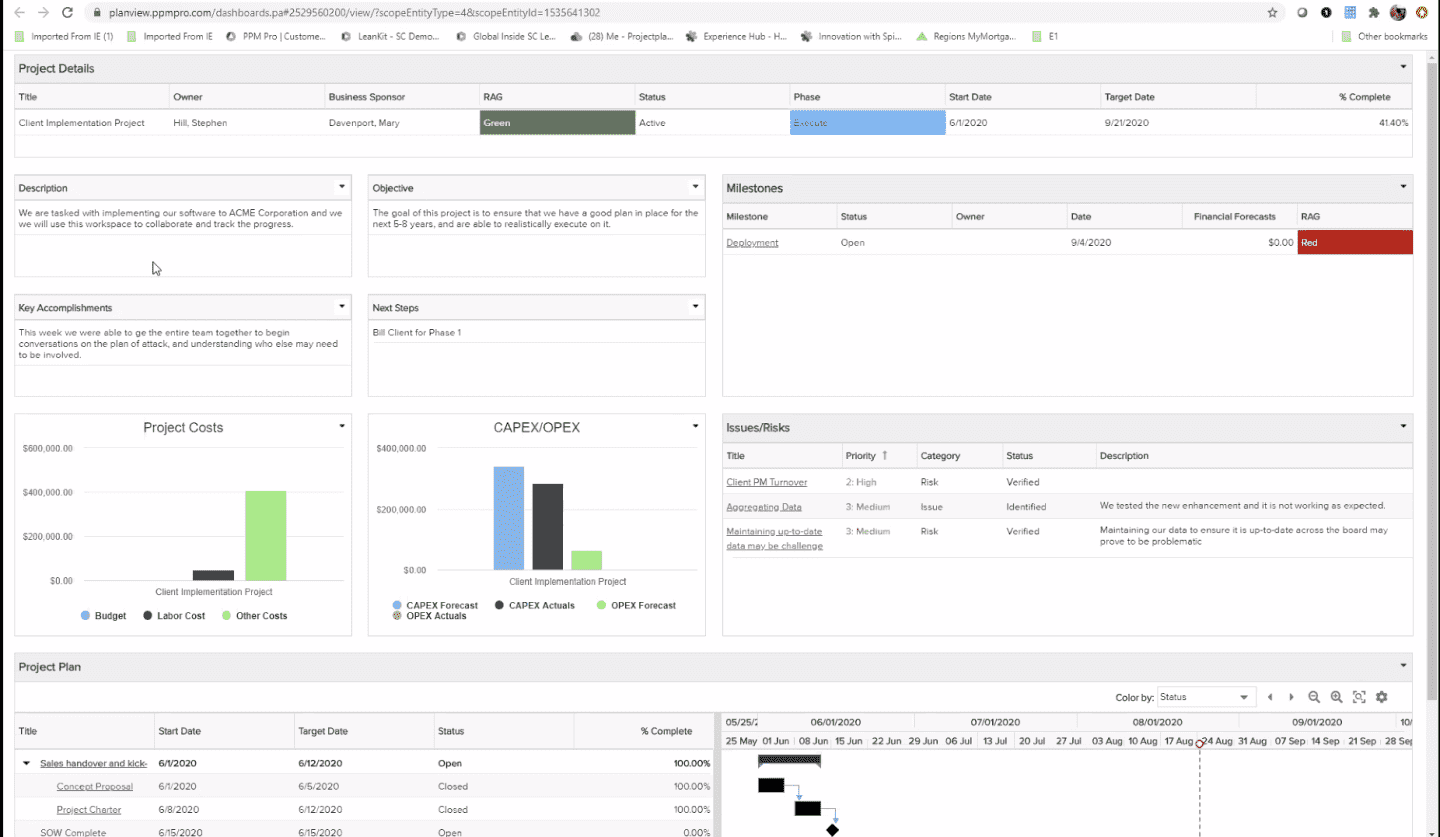 |
Project Status Dashboard - Provides a consolidated view of a project's important details, overall status and health, key milestones, issues and risks, costs, and the project plan |
| 6 |
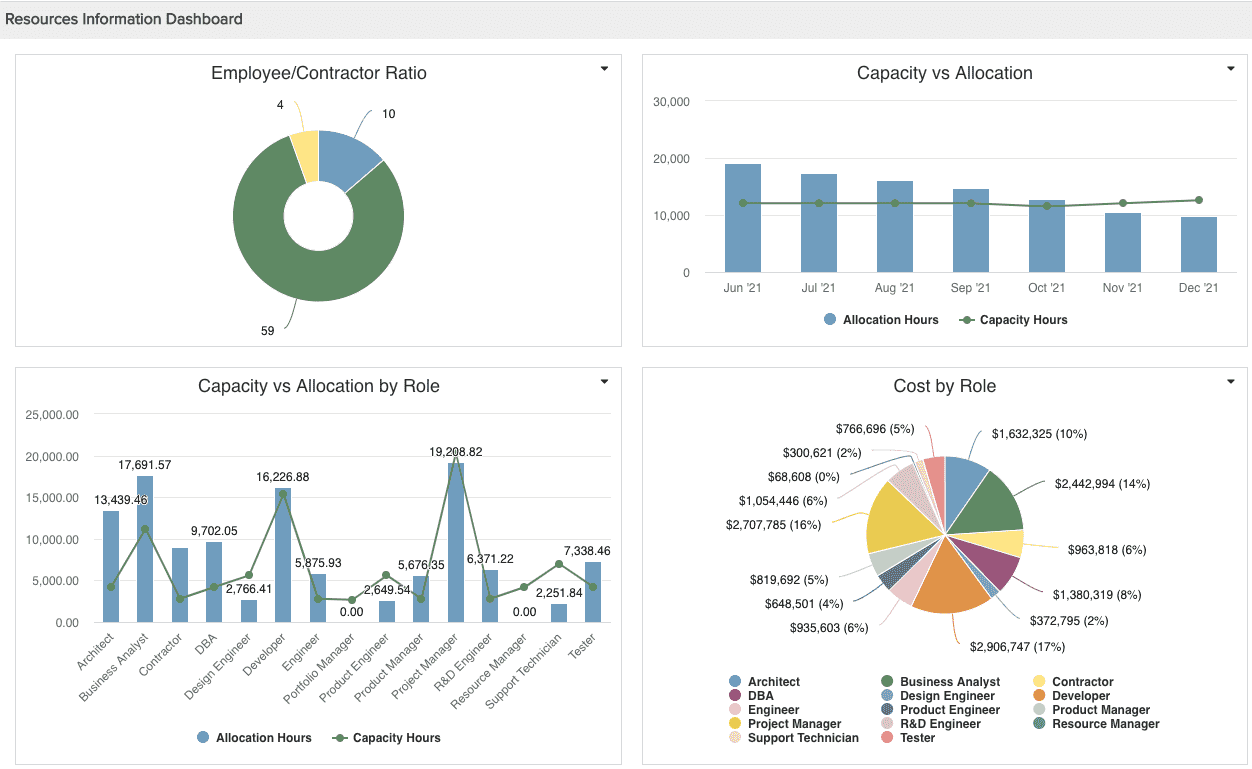
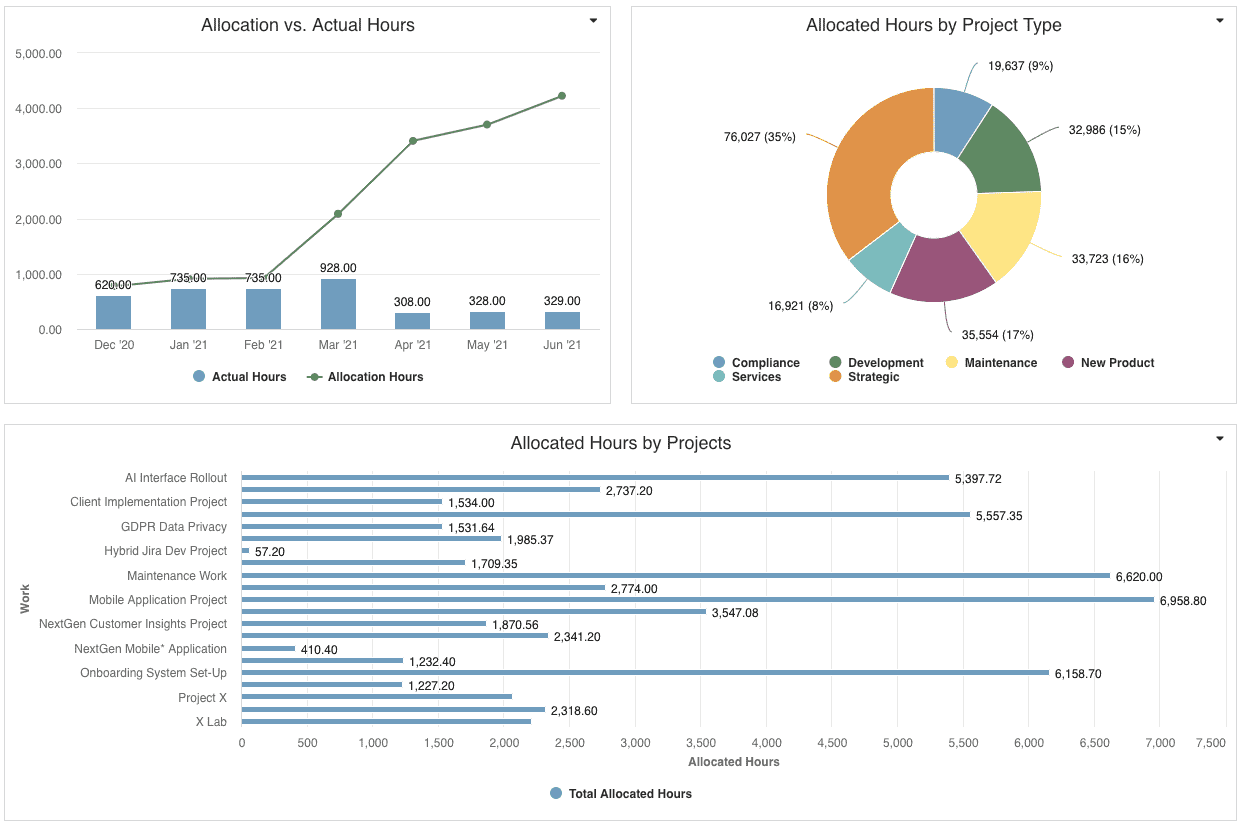
|
Resource Management Dashboard - Summary of resource and role visualizations, including employee type breakdown, capacity versus allocations versus actuals, costs by role, demand by project type, and project allocated hours |