Interpreting Capacity
In PPM Pro, a resource has one primary role and potentially a secondary role. The PPA engine looks at all roles and will potentially allocate a resource to any role he or she has in order to include a project and increase the value of the scenario result. There is no distinction made between primary and secondary roles for PPA, it just assumes that the resource with those roles is capable of performing those roles.
An important thing to remember is that capacity ultimately comes from resources, not roles. Where this comes into play is when interpreting the residual capacity returned by the engine when resources can play multiple roles. Residual capacity will be correct for any given role individually. Having a value for residual capacity helps to identify which roles are the limiting factor in your optimization and to see how efficiently you are using various roles. To see the total residual capacity across the entire scenario (computed by summing the residual capacity of each individual resource), view the Scorecard tab.
For example, let's say resource "J.J. Watt" has role "Defensive End" and "Wide Receiver" and has capacity of 40 hours in some week. Each role has the correct available capacity when considered individually. The 40 hours is included in both roles.
However, let's say that J.J. Watt gets allocated for 30 hours in project "Practice" in that week, the available capacity remaining for other projects becomes 10 hours in both "Defensive End" and "Wide Receiver". If J.J. Watt isn't allocated to any other projects in that week, this will become 10 hours of residual capacity in both roles. The correct way to interpret this is that you have 10 hours of unused capacity in either "Defensive End" or "Wide Receiver" (but not both at the same time).
The total residual capacity shown on the scorecard would be 10.
Residual Capacity vs Residual Hours
The Residual Hours value that you see on the PPA Scenario grid is computed from total capacity minus allocated hours for the scenario.This is the capacity the PPA engine has for planning. This value can be larger than the Residual Capacity value seen on the scorecard, which takes into account demand outside the scenario. If the demand has over allocations, the result for Residual Hours will be greater than the Residual Capacity. Residual Capacity that you see in the Scorecard is the remaining capacity after resources that were included in the scenario have been allocated.
Example
Below is an example of residual hours as seen on the PPA grid vs residual capacity seen on the scorecard. This example follows one employee (Anthony Geld) who is allocated to two projects: Already Allocated and AG Test 1.
Allocations and Demand
Already Allocated (Allocations)
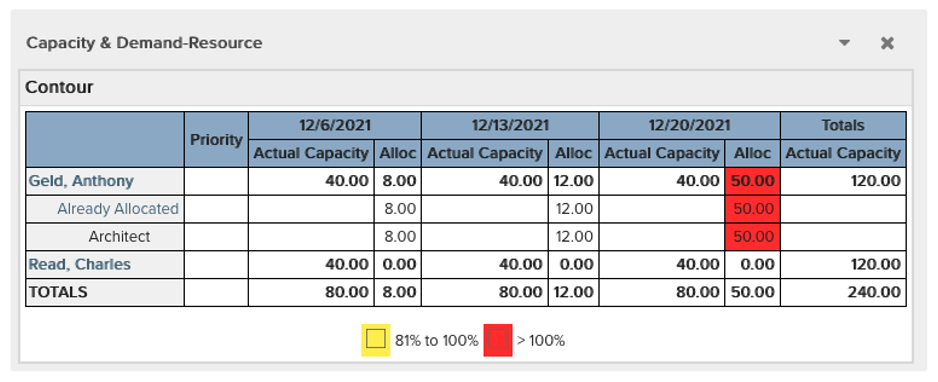
There is demand for 70 hours; Anthony Geld has a capacity of 40 hours/week. The week of 12/20 he is over-allocated by one week (5 working days).

AG Test 1 (Demand)
For this one week project (5 working days), there is the following demand:
- 20 hours for “Architect”
- 40 hours for “DBA”

Capacity & Demand Report
You can run a capacity & demand report on these 2 projects, as shown below. You can see that Anthony Geld's actual capacity = 40 hours.

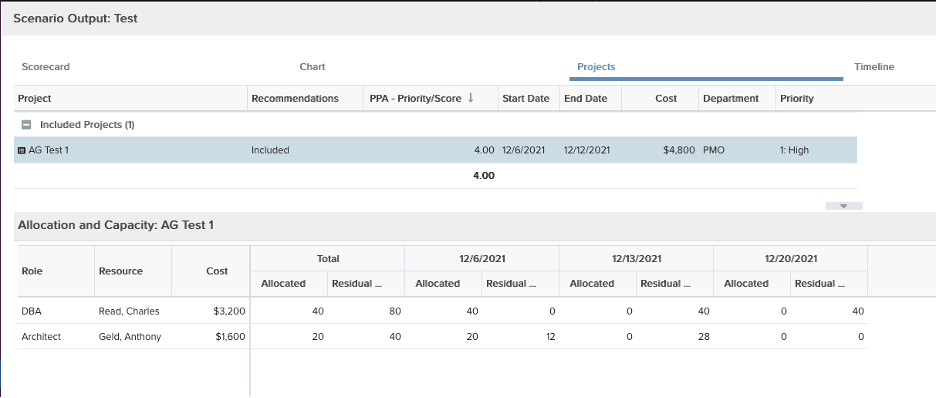
Now let’s run PPA to schedule resources to “AG Test 1”; the other project is used for external allocations


Charles is allocated 40 hours for week 1, and Anthony is allocated 20 hours for week 1.
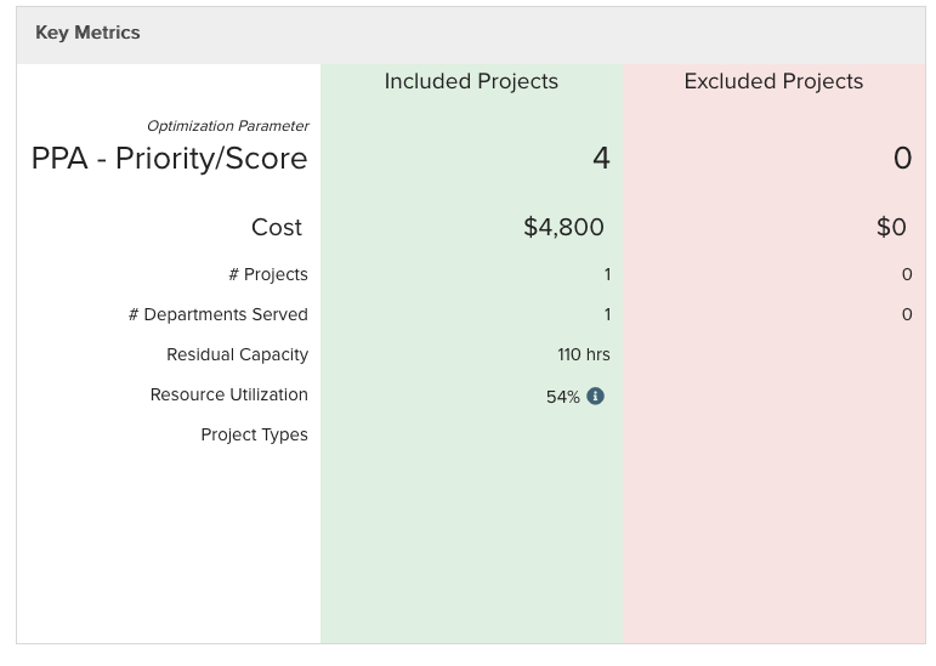
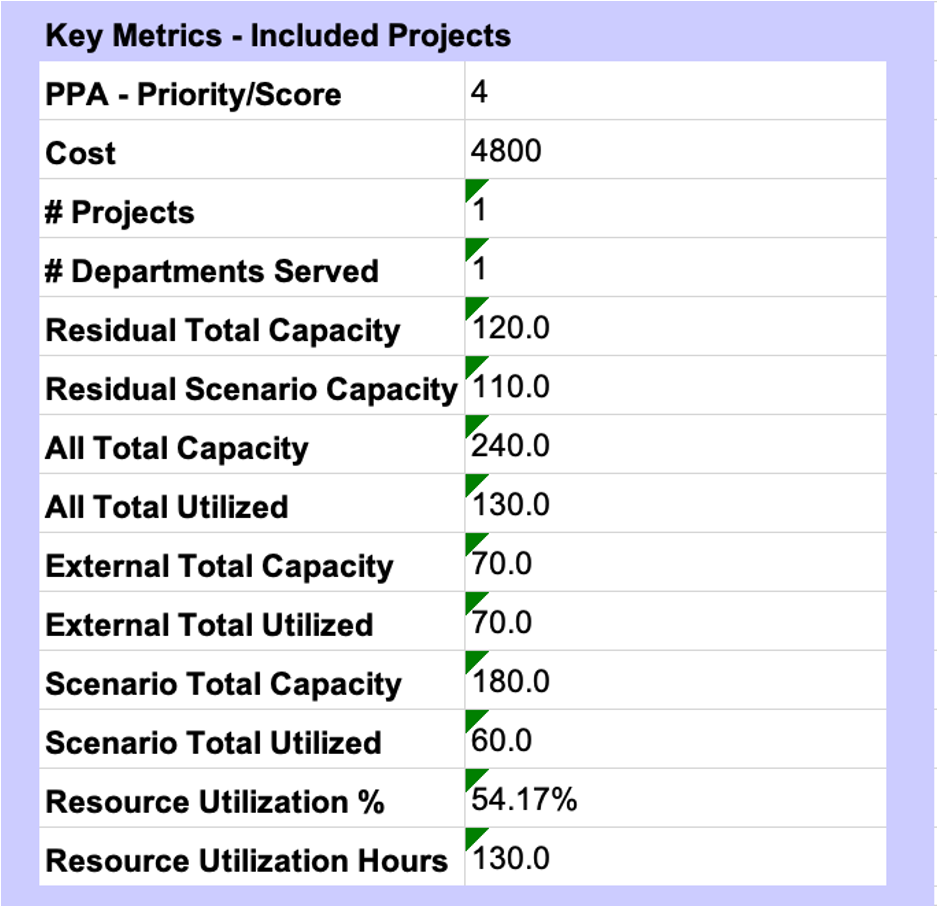
The scenario output can be exported to Excel. The export includes key metrics, as shown below.

Charles had capacity [ 40, 40, 40 ] for the planning horizon.
Anthony had capacity [ 32, 28, 0 ] for the planning horizon. Note: He was over-allocated for week #3 by 10 hours, but that doesn’t affect capacity: Capacity is 0 for that week.
Total capacity before PPA run: 40 + 40 + 40 + 32 + 28 => 180 hours.
Allocations before PPA run: 8 + 12 + 50 => 70 hours.
“Residual Scenario Capacity” is computed from those values: 180 - 70 => 110 hours. However, this value is skewed because Anthony was overallocated: 50 hours allocated for week 3 reduces his capacity only by 40 hours.
|
Anthony Geld |
Week 1 |
Week 2 |
Week 3 |
Total |
|---|---|---|---|---|
|
Capacity |
40 |
40 |
40 |
120 |
|
Allocated |
8 |
12 |
50 |
70 |
|
Remaining Capacity |
32 |
28 |
0 |
60 |
“Scenario Total Capacity” is 180 hours (120 hours for Charles and 60 hours for Anthony)
|
Anthony Geld |
Week 1 |
Week 2 |
Week 3 |
Total |
|---|---|---|---|---|
|
Capacity |
40 |
40 |
40 |
120 |
|
Allocated (Already Allocated) |
8 |
12 |
50 |
70 |
|
Allocated (AG Test) |
20 |
0 |
0 |
20 |
|
Remaining Capacity |
12 |
28 |
0 |
40 |
|
Charles |
Week 1 |
Week 2 |
Week 3 |
Total |
|---|---|---|---|---|
|
Capacity |
40 |
40 |
40 |
120 |
|
Allocated (AG Test) |
40 |
0 |
0 |
40 |
|
Remaining Capacity |
0 |
40 |
40 |
80 |
After PPA run, remaining capacity is 40 + 80 -> 120 hours. (“Residual Total Capacity”).
If we now take the total capacity (240 hours) and subtract the allocations (8 + 12 + 50 + 20 + 40) we get 240 - 130 => 110 hours.
If there were no over-allocations, then both values should be the same.

