Financial Entry Reports
Note: Financial entries do not roll into Labor/Non-Labor reports. ALSO, if you would like to use new reports instead of Legacy report (which this topic page applies to), in lieu of a crosstab report type for time series data, it is best to use a List: Time Series report type.
There are two sets of report sources available for reporting on financial entries (forecasts and actuals).
"All Financials Entries" and "All Financial Planning...Times Series" report sources can be found within the Finance report category for the following report targets: Organization, Division, Department, Portfolio, and Project.
All Financial Entries Report Sources
"All Financial Entries" are basic reports that let you report on the information that informs the project Financials section of one or more projects. For example, reports that return the list of forecasts and/or actuals for a project (or a set of projects, or all projects in an organization), the variance, and so on. The report can include any available field from financial entries as well as related entities such as projects and divisions. These report sources are across all time unless a specific date filter is used when running the report and include:
- All Financial Entries
- All Financial Entries on a Project
- All Financial Entries on Projects in a Department
- All Financial Entries on Projects in a Division
- All Financial Entries on Projects in a Portfolio
- All Financial Entries on Projects in a Portfolio and its Sub Portfolios
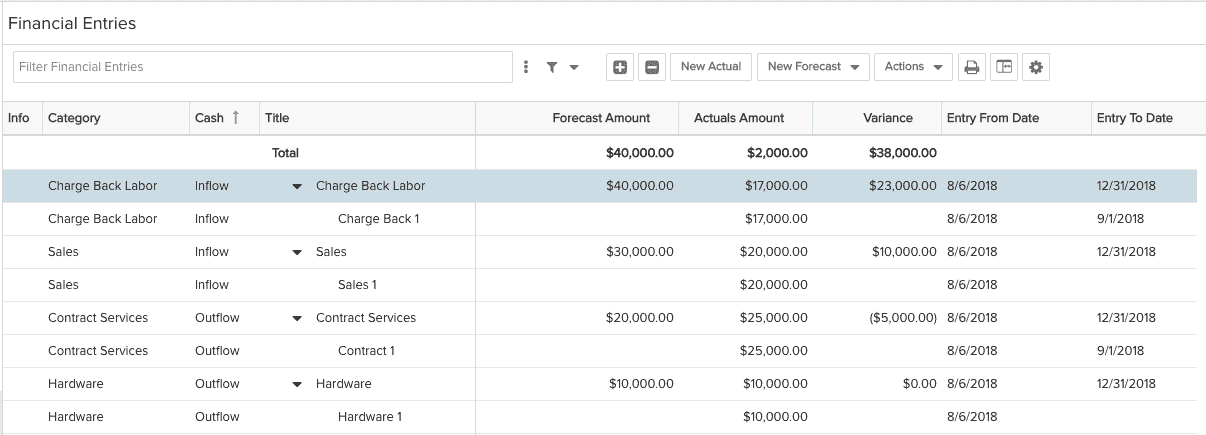
An example All Financial Entries on a Project List report might look like the following:
All Financial Planning...Time Series Report Sources
"All Financial Planning...Time Series" reports allow reporting on project Financials data in monthly intervals for a specified time period. The report can include the financial planning date (for the monthly time series aspect) as well as any available field from financial entries and projects. These report sources require that a date range be specified when running the report and include:
- All Financial Planning by Financial Entries on a Project Time Series
- All Financial Planning by Financial Entries on Projects in a Department Time Series
- All Financial Planning by Financial Entries on Projects in a Division Time Series
- All Financial Planning by Financial Entries on Projects in a Portfolio and its Sub Portfolios Time Series
- All Financial Planning by Financial Entries on Projects in a Portfolio Time Series
- All Financial Planning by Financial Entries Time Series
Forecast Amount and Actuals Amount fields
To provide some reporting flexibility, we have provided 2 versions of the Forecast/Actuals Amount fields: one that provides an absolute value and one that provides a signed value.
- Use Forecast Amount and Actuals Amount fields to get a total value for each type of entry - regardless of whether it was revenue or an expense (all numbers treated as positive).
- Use Forecast Amount Signed and Actuals Amount Signed to get the actual value of the field, so that the total accounts for inflows/outflows (numbers treated as positive or negative, as appropriate).
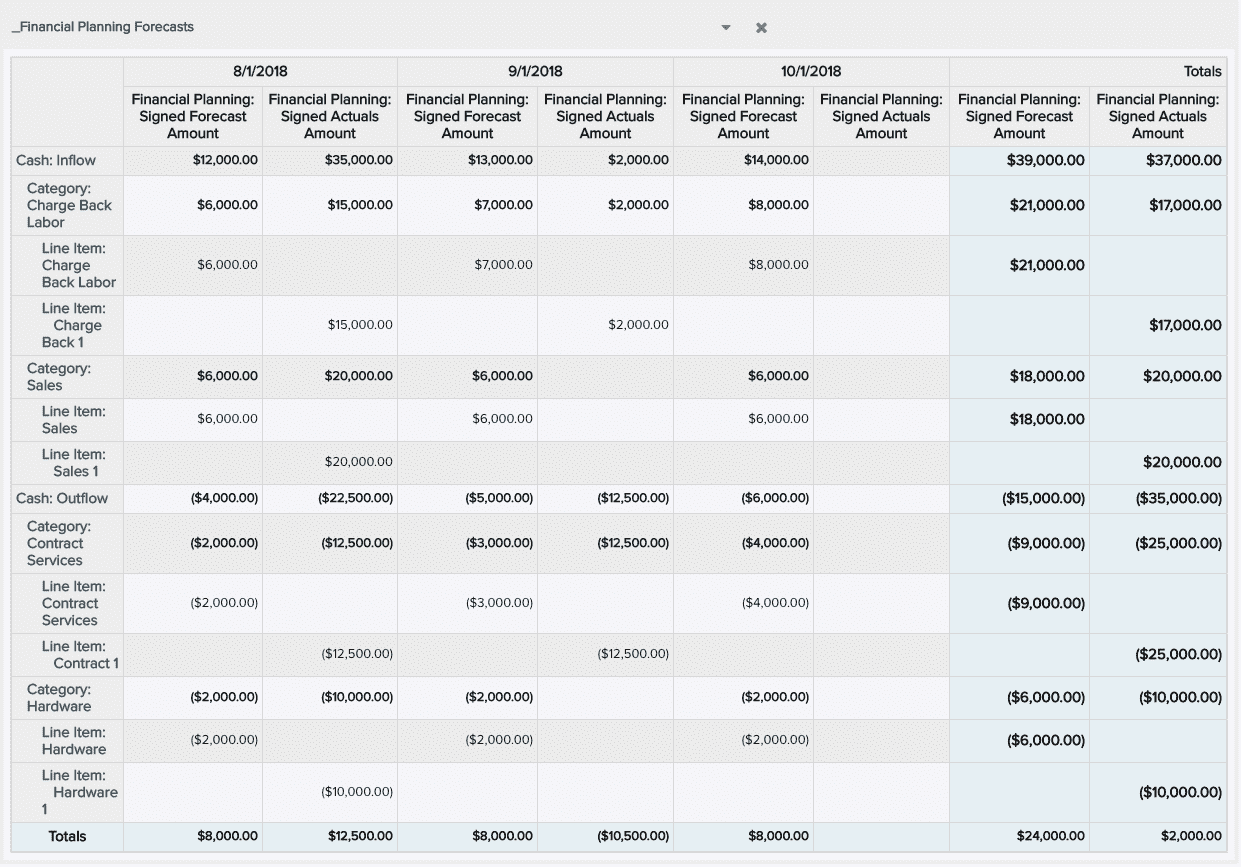
Example: Use signed fields to create report that shows forecasts, associated actuals and their total per forecast, and totals of all forecasts/actuals.
When to Use Fields from Finance Entity folder vs Finance Planning folder
Like with all report sources, it is a best practice to use fields from the primary entity folder.
- Finance Planning folder fields are used for contoured values - use the fields in this folder for time series reports (sum total).
- Finance Entry folder fields is for totals - use the fields in this folder for reporting on the metadata of financial entries (monthly amount).
Example
Here is a sample forecast entry:

The Forecast Amount of $33,000 is the value you get from the Forecast Amount field from the Financial Entry folder. The monthly contour amount is what you get from the Forecast Amount from the Financial Planning folder - $10,000 for Aug and $5,000 for Sept.
Now lets look at a report with a 2 month planning horizon of 8/1 - 9/30.
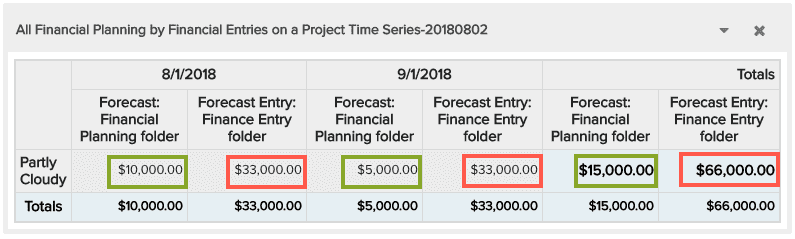
In our example above, the planning horizon was 2 months - Aug-Sept.
- The numbers in green are derived from the Forecast Amount field from the Financial Planning folder - it is providing the contoured forecast amount for each month in our horizon ($10,000, $5,000 = $15,000).
- The numbers in red are derived from the Forecast Amount field from the Financial Entry folder - it is providing the total Forecast amount for the entire project - each month. So instead of the correct Total for 2 months of $15,000, you get the the total Forecast amount ($33,000) for each of the 2 months in the planning horizon, resulting in an inaccurate total of $66,000. If you play it out for another month, you'll have a total of $99,000, and so on.
You can see that if you use the Finance Entry field in a time series report, the finance entry data series fields do not represent the timeline horizon that you are reporting, but the entire forecast.
Example Reports Using the Finance Entry Report Source
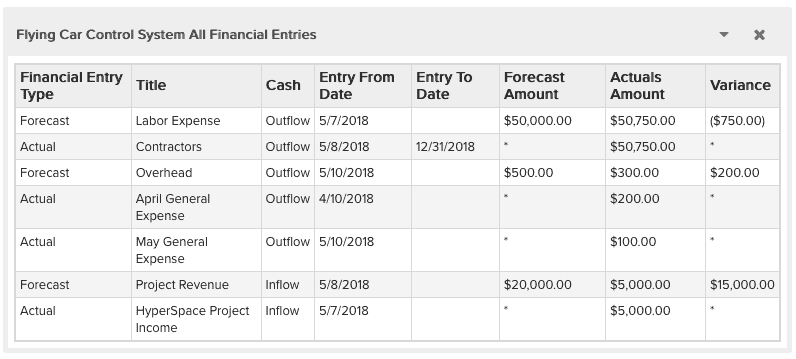
The following are some example finance reports based on the Finance Entry report source. The financial entries used for these examples are shown in the screenshot below:
Use signed values, there is an edge case for absolute value version of the field.
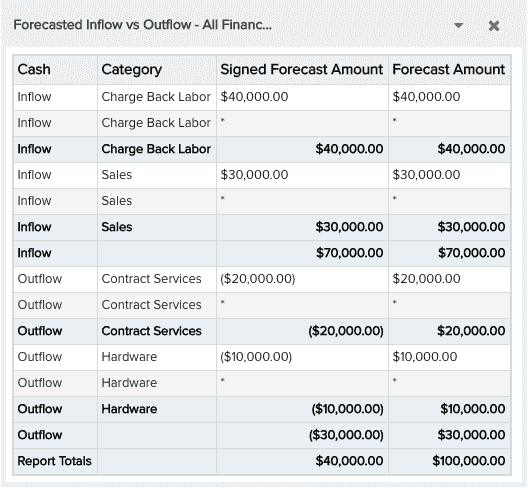
Example 1. Inflows vs Outflows
List report - Signed outflow values are shown as negative numbers - (in parentheses). Outflows, by definition, are negative.
Report definition:
- Field Selection tab - Cash, Category, Signed Forecast Amount, Signed Actuals Amount, Aggregate = Sum
- Sorting tab, add Cash, Category, Group By each
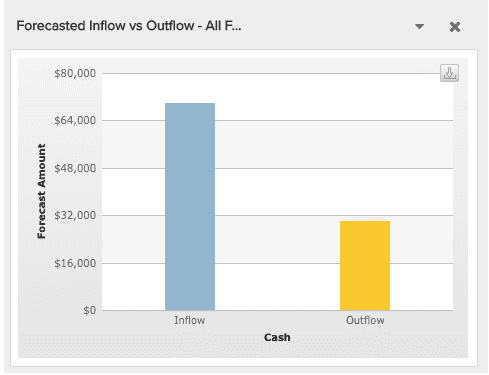
Example 1. Bar chart - Use Forecast Amount - results in both bars above line.
Report definition:
- Category Field - Financial Entry/Cash
- Data Series Field - Financial Entry/Signed Forecast
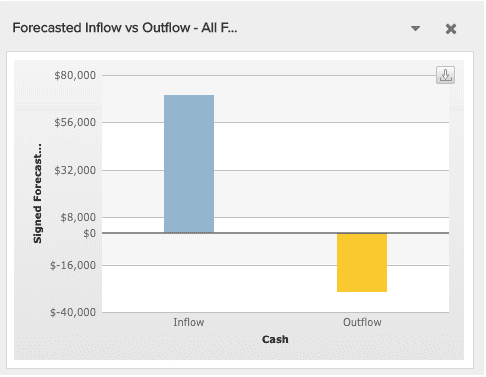
Note that if you use the signed fields, the positive outflows are displayed below the line.
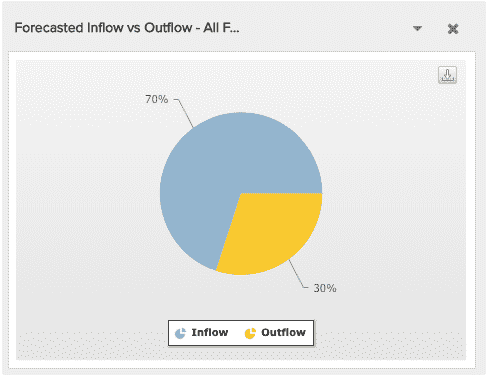
Example 3. Pie chart - Use Forecast Amount or Signed Forecast Amount
Report definition:
- Chart type - Simple Pie Chart
- Category field - Financial Entry/Cash
- Data Series field - Financial Entry/Forecast Amount
Example Reports Using the Time Series Report Source
Example 1. Crosstab report of forecasts vs actuals, groups by Cash and then Category