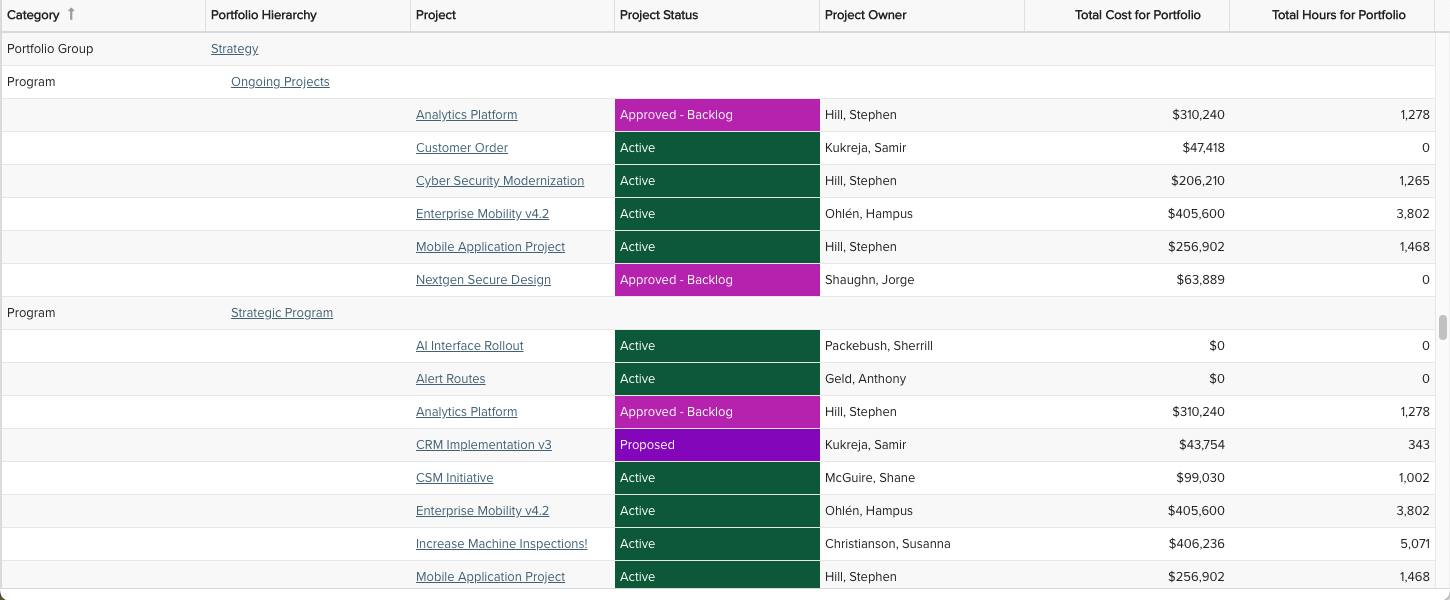
Portfolio Hierarchy with Project Details Considering % to Include
This report shows by category a portfolio hierarchy with projects linked to each portfolio and details, including numeric values based on the % of the project to include in the portfolio (very useful if you have projects with % to include less than 100% associated to one or more portfolios). You can build this report using the design settings in the table below. Alternatively, you can download this report definition and upload it to your PPM Pro instance.
| Design View | Selection | Comments |
|---|---|---|
| General |
Topic: Portfolio Type: List: Basic Title: <enter a meaningful title>
|
|
| Data |
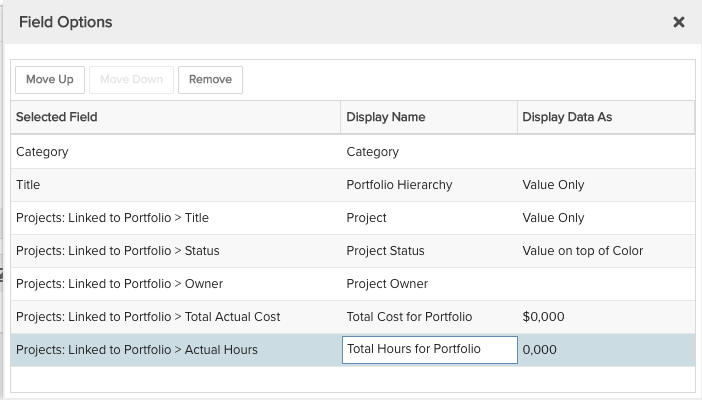
List Fields: Whichever of the following and others would be of value, such as
|
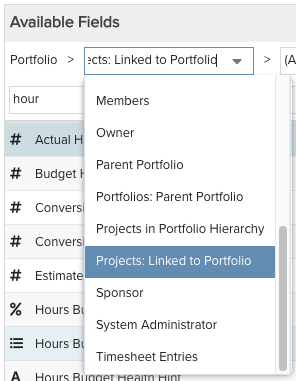
When starting with the Portfolio topic you will need to select the field path Portfolio > Projects: Linked to Portfolio to get to the project available fields. For example:
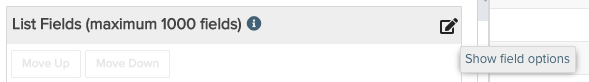
Note that you may want to replace the "Total Actual Cost" standard field with "Total Actuals (Financial Summary)" standard field if the Financial Summary is in use for these projects (and possibly add other Financial Summary fields such as "Total Budget (Financial Summary)" and "Total Forecast (Financial Summary)"). To change the data field Display Name or Display Data As, for example from "$0,000.00" to "$0,000", within the List Fields area title select the edit icon for "Show Field Options" and in the resulting "Field Options" modal, edit the field options.
|
| Display and Preview List Columns |
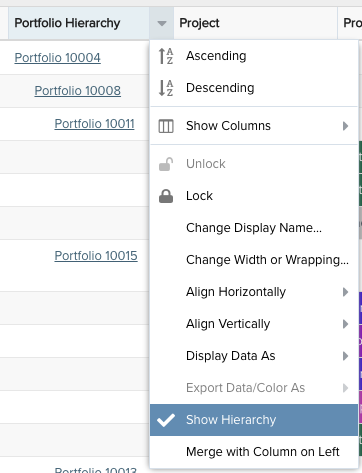
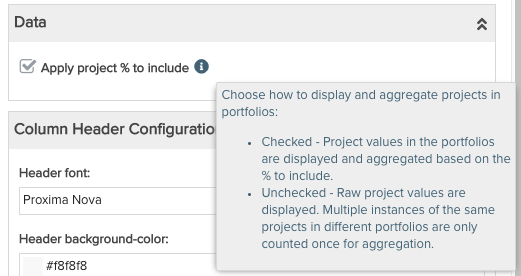
Set desired Display options, such as: Data: Select the "Apply project % to include" checkbox is one or more of your projects contribute less than 100% to its associated portfolio(s) Sorting: Sort by Field "Category" with Group By "Do not group" Drill Down: Select Drill Down as "Entity" for both Portfolio Hierarchy and Project fields Aggregation: Select Aggregation "Sum" for Total Cost for Portfolio and Total Hours for Portfolio fields Within the Preview pane, select the Portfolio Hierarchy column's options menu and "Show Hierarchy" to represent the portfolio hierarchy:
|
The "Apply project % to include" only appears if the portfolio report includes numeric project fields.
|
| Variable Settings |
Scope: Portfolio Filters: optionally include portfolio or project filters
|
Selecting the Portfolio Scope will cause this report to be available on Portfolio Report grids so it can be run for associated portfolios. You can select other Scope options if you want this report to be shown in other entity grids as well. As needed, you can also include Filters. If you want to allow the user to change to a different Scope and/or Filter before running the report or when viewing the report, select the relevant checkboxes for Allow changing. |