Using the Report Designer
This video provides an overview of the report designer – this is where you build, edit, test, and run reports.
The report designer consists of a toolbar, design area, and a preview pane with real-time preview. Duration 5 min.
The report designer is where you create and edit reports by choosing the report type, selecting report data, formatting and positioning the data, running, testing, and iterating until you get the report you want. The WYSIWYG Preview Pane speeds this process along, so by all means, use a trial and error approach, it's better than a tome of documentation!
The report designer opens in a new browser tab when you create a new (click New on the Reports list), edit or copy an existing report, and consists of a Toolbar, a Design area, and the Preview pane.
Overview
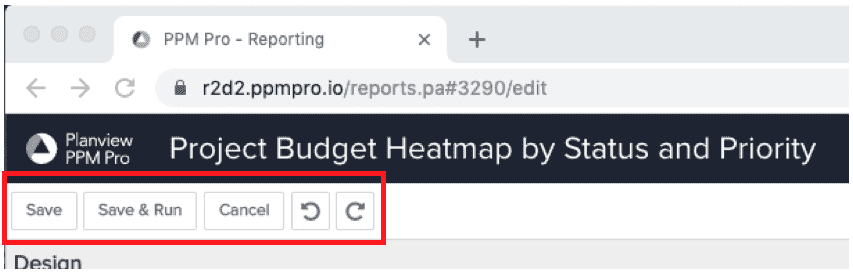
Toolbar
The report designer toolbar has a few key functions to be aware of and which will make your life easier:
- Save - Simply saves your new report or all the changes since the last save.
- Save & Run - Saves your new report or all the changes since the last save and also opens the actual report in a new tab. Running the report allows you to test what options show up at initial runtime as well to see exactly how the report will appear to your viewers with actual data. Although the Preview area described below is also intended to show you what your viewers will see, it will display sample and not actual data in order to optimize design display performance.
- Cancel - Discards all changes since the last save. If you want to cancel creation of a new report and have not yet saved, then you will need to close the report designer tab.
- Undo - Incrementally reverts each change you have made, from most recent to less recent, up until you last saved. This is represented by the counter-clockwise circular arrow icon button.
- Redo - Incrementally recreates each change you have recently undone, from most recent to less recent, up until you last saved. This is represented by the clockwise circular arrow icon button.
Design Area
The design area is the main left hand section of the report designer. It can be collapsed, expanded, and resized to accommodate your needs. Its tabbed sections allow you to enter and select various design options that impact to whom, how, and where your report will appear:
- General - Enter basic details about the report, such as what the report is primarily about (Topic), what the report visualization form should be (Type), a Title for the report, and optionally a report Description.
- Data - Select the data fields that inform the report given its Type. Access the Field Options dialog where you can format data values.
- Display - Configure various headings, axis, legend, and other display options, including font, font style, size, and location, based on the report Type.
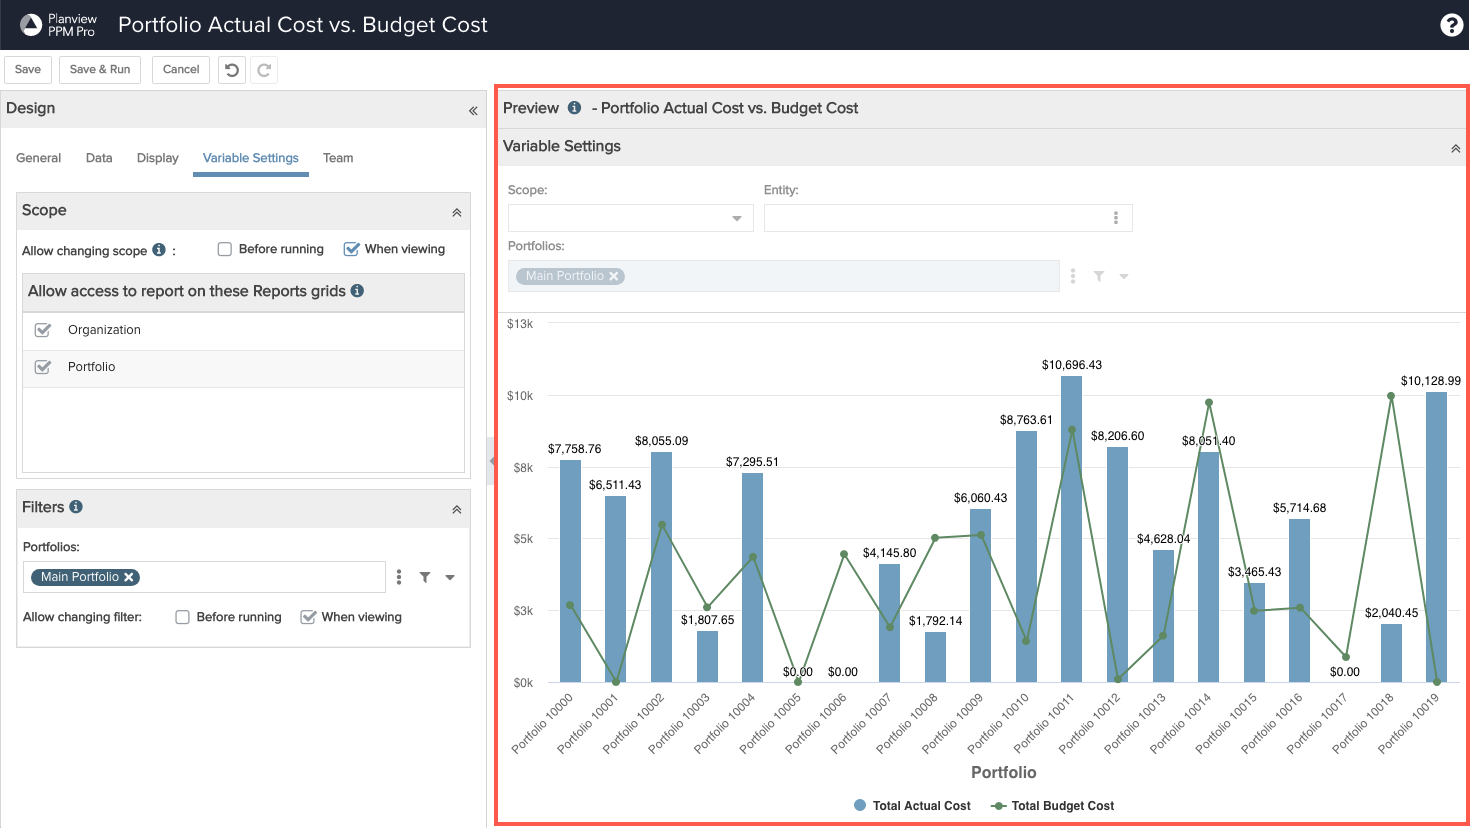
- Variable Settings - Configure at what level you want the report to be able to be run at and in what entity report grids it should appear (Scope). Based on the report Topic and what Data fields were selected, you can also configure initial Filters to limit the data shown in the report. For both Scope and Filters, you can optionally allow your viewers to initially change these at runtime and/or while viewing the report.
- Team - Controls who else can view, edit, and delete your report, given their permissions.
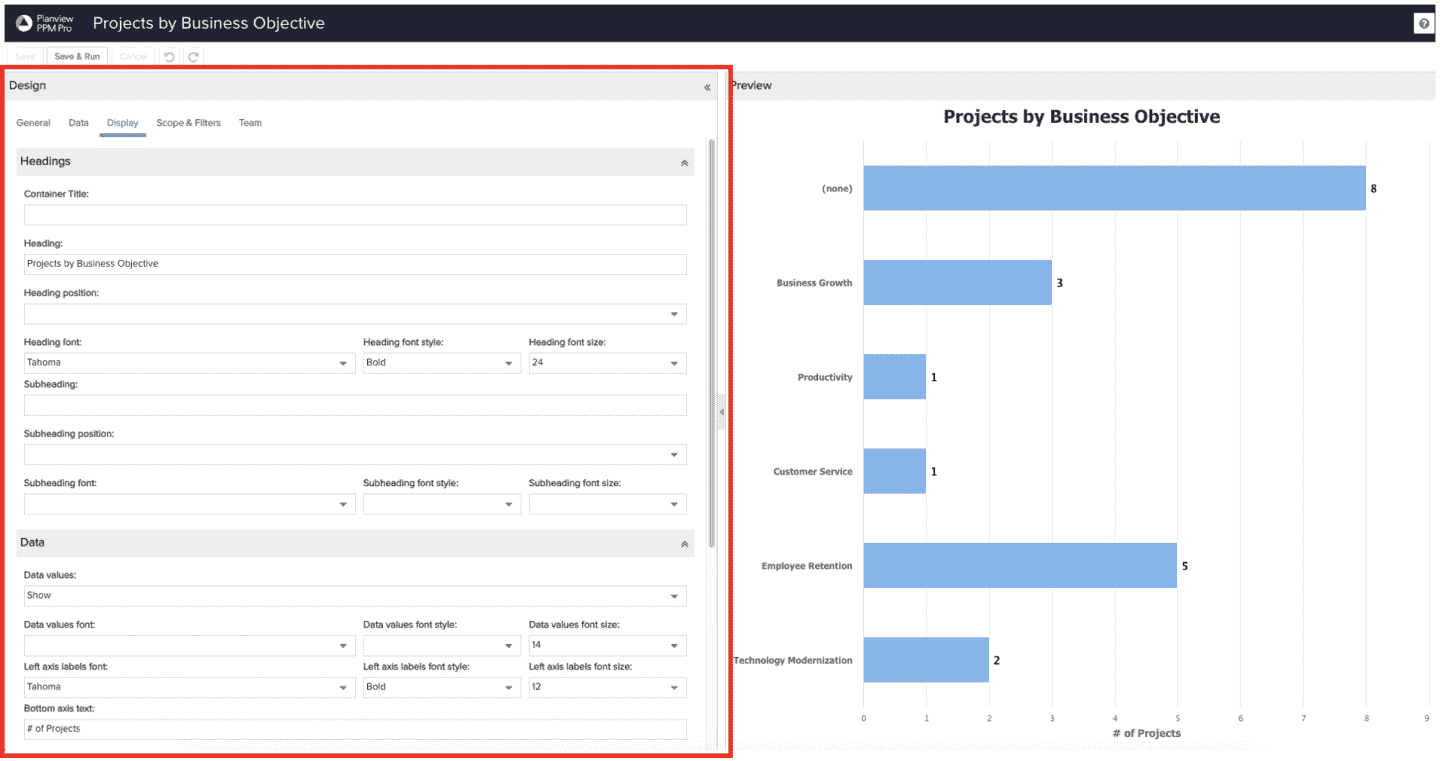
Preview Pane
The Preview pane is the right-hand section of the report designer. It can be resized to accommodate your needs. As you design your report, particularly after you have selected the minimal required data, it automatically updates to show the impact of your selections. For List reports, most design choices can be made within the Preview pane by using column header drop-down menu options (see WYSYWYZ Layout/Editing for List Reports for more details).
The Preview pane uses sample data so that it is snappy and responsive, enabling you to quickly see the implications of your design choices. Note that when showing Scope or Filters as View Options, they are shown within the Preview but do not affect the sample data. If ever you need to see how your report will look with actual data and test changing Scope or Filters on initial runtime or while viewing the report, simply click the toolbar Save & Run button and your report will open in a new tab.