
Projects by Priority and Status
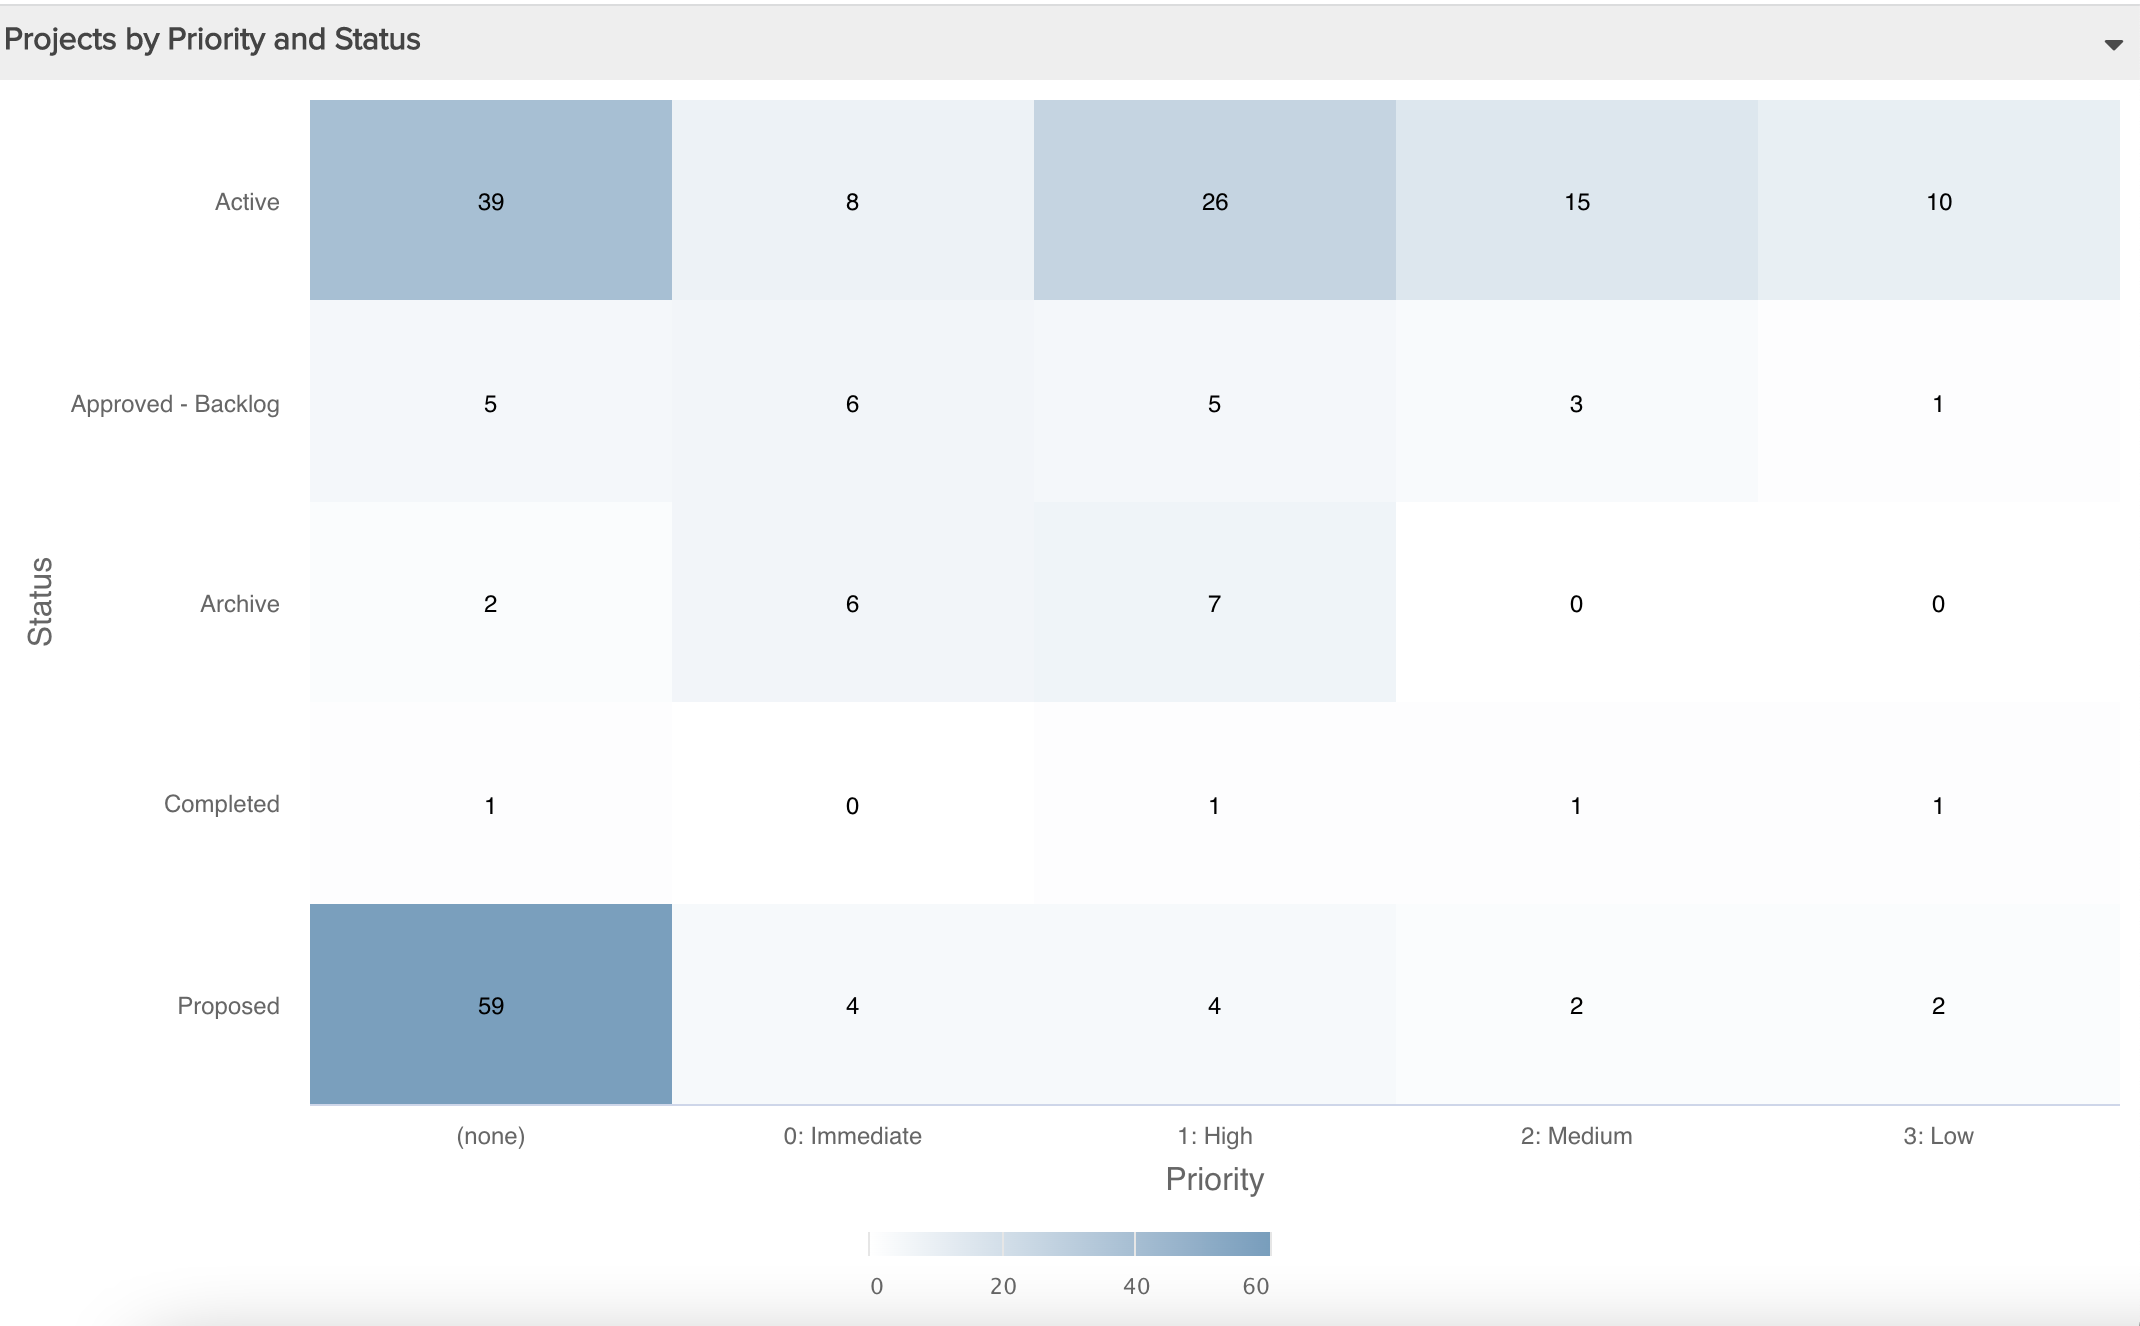
This report uses a heatmap to show the distribution of projects given two attributes, such as Priority and Status. You can build this report using the design settings in the table below. Alternatively, you can download this report definition and upload it to your PPM Pro instance.
| Design View | Selection | Comments |
|---|---|---|
| General |
Topic: Project Type: Heatmap Title: <enter a meaningful title>
|
Another report Type that works well is Crosstab. |
| Data |
Bottom Axis: Priority (or other field of interest) Left Axis: Status (or other field of interest) Values: Count (or other field of interest, such as Total Actuals and so on) |
|
| Display | Configure desired Display options. | |
| Variable Settings |
Scope: Portfolio Filters: optionally include a project filter
|
Selecting the Portfolio Scope will cause this report to be available on Portfolio Report grids so it can be run for associated portfolios. You can select other Scope options if you want this report to be show in other entity grids as well. As needed, you can also include Filters. If you want to allow the user to change to a different Scope and/or Filter before running the report or when viewing the report, select the relevant checkboxes for Allow changing. |