Drilldown links
A drilldown is a link in the report output that the user clicks to display another report, the PPM Pro entity Info page, or a dashboard. You can create a drilldown link from most field types. Drilldown links are active for reports that are contained in published dashboards.
Drilldowns retrieve current data, which can be inconsistent with the information on the dashboard. A published dashboard is a snapshot in time, but drilldowns pull in live data.
- For Bubble reports, drilldown links are on the bubble size object.
- For Stacked Column reports, you can configure a drilldown for each segment of the column.
- For Crosstab reports, when you configure an entity link you will not get to choose what you drill down into. The link reruns the same report, filtered for the linked entity (the report is displayed below the original crosstab report). Then, from the filtered list report, you can drill down again to get to the entity instance. If you don't initially see the list report, adjust the report modal by scrolling and/or resizing until you see the report (usually in the lower-right corner of the modal). See Example Crosstab Report.
Note: A filter you apply to a drilldown report will be applied in addition to any filter that was already applied to the report in the report Set Filters dialog. For example, if the report filter is "all open projects" and the drilldown filter is "all open issues," then the drilldown report will display all open issues for all open projects.
Drilling down to dashboards
You can drill down from a report to an entity-level dashboard.
Typically you'll have a set of entity-level reports, such as All Tasks on a Project, All Issues on a Project, All Resources on a Project, and so on. These reports will be configured on a "detail" dashboard (an entity-level dashboard that is called by the drilldown link). Then you create a report at any entity level that is higher than the entity-level reports. For example, Organization or Division (Business Unit). This report will contain a drilldown link to the "detail" dashboard. Drilldowns to entity-level dashboards are available for list and bubble output types (because a row/bubble represents one entity).
To create a drilldown link
- Locate the field in the Selected Fields area where you want to create the drilldown.
- Click on the drilldown icon
 .
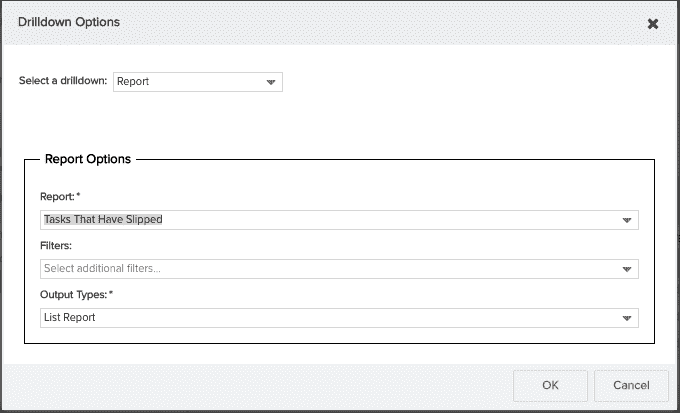
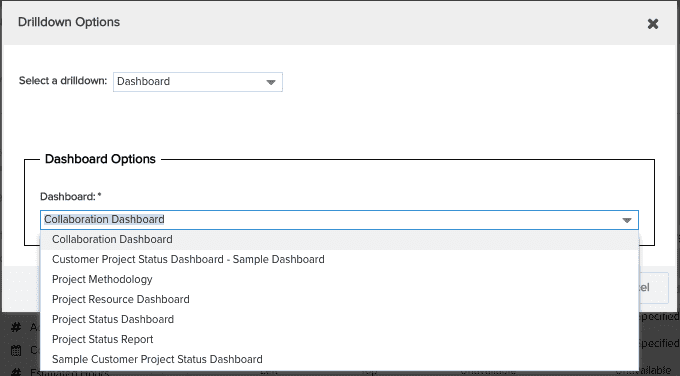
. - In the drilldown dialog, choose whether to drilldown to the entity to which the field belongs, or to a specific report, or to a dashboard.
a) If you choose Entity, then the drilldown link is configured to display the Info page for the entity to which the drilldown field belongs. For example, imagine a Timesheet Entry report with a drilldown link on the resource field. The link will drilldown to the resource's Resource Info page. (Remember that enitity drilldowns work differently for crosstab reports; click here for information.)

b) If you choose Report, additional settings appear where you can select the report to display and the output type. You can optionally apply a filter. Filter and report eligibility depends on the reporting entity and field on which the drilldown is based.
Note: A filter you apply to a drilldown report will be applied in addition to any filter that was already applied to the report in the report Set Filters dialog. For example, if the report filter is "all open projects" and the drilldown filter is "all open issues," then the drilldown report will display all open issues for all open projects.

c) If you choose Dashboard, an additional setting appears where you will select the Dashboard to display. Only entity-level dashboards will be available.

Note: If you select Dashboard but do not have any related entity-level dashboards, you will see the following message:

- Click OK.
If you have configured a drilldown, when you click on a link or a bubble, the target report will be run and displayed below the current chart.

