Formatting Column Values
NOTE
The ability to format column values is available for list reports and entity grids (Issue/Project Log List, Portfolio List, Project List, Request List, and Task List). Since this feature works the same way in either context, we are covering it in one topic. You might see references to both entity grids and list report columns.
For entity grids, the formatting is specific to each user - there is not currently a way to specify global formats. Note that if you choose Reset To Default Settings from the resource menu, you will lose your formatting entity grid formatting.
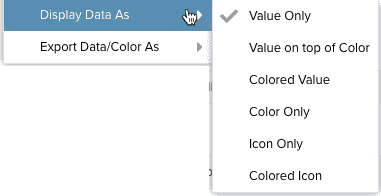
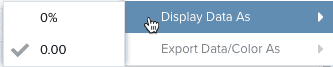
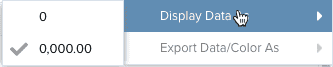
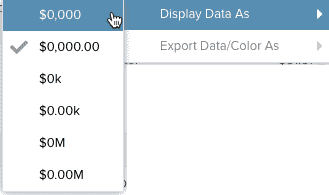
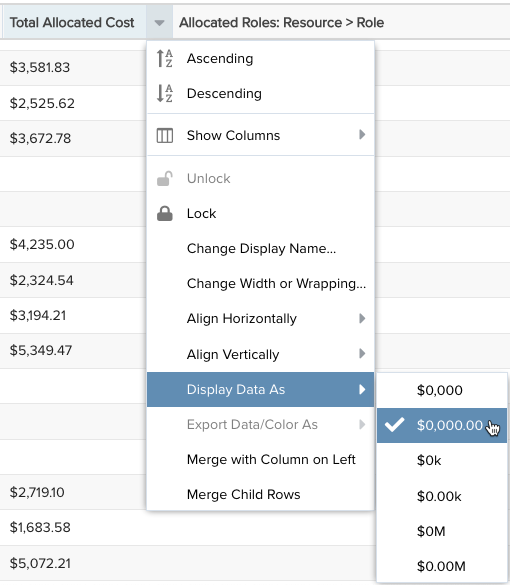
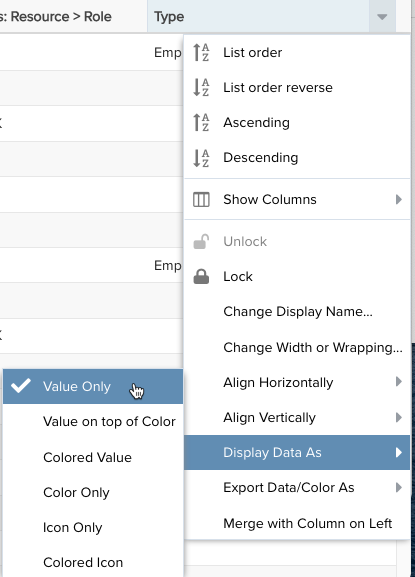
In the context of a List report or the entity grids mentioned above, an extensive header menu option called "Display Data As" is available for applying formatting to list fields, number fields, and date/time fields. The screenshot below (left) shows the Display Data As menu for a numeric fields with a currency data type; the screenshot below (right) show the Display Data As menu option for a list field:
|
Display Data As for numeric (money) fields
|
Display Data As for list fields
|
Formatting Data - "Display Data As"
The Display Data As menu header item is dynamic - it displays different menu items depending on the type of field you have selected. For example, select a lookup list and choose Display Data As to apply color to the value in the field, or the background, or both. If you select a numeric field, you'll get various options to specify things like the number of decimal places or currency indicator, whether to format percent fields to display whole numbers or decimals...and so on.
The Display Data As menu options for the different fields types are described below. Note that this menu is also available for entity grids, such as the Projects List, the Requests List, and the Tasks list.
Fields Types:
The formatting options for the above field types are described below:
| Menu Item | Description |
|---|---|
|
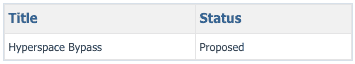
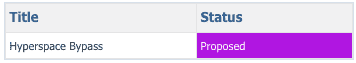
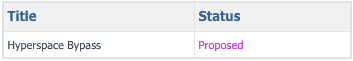
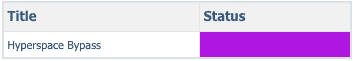
Lookup lists can be assigned a color and/or an icon for each list value. When using a lookup list in a report/grid that is configured to use color/icon, you can choose the visual treatment to apply to the list field value by configuring the "Display Data As" setting. Note that Pie charts and Column charts automatically use any lookup list color assignment.
|
Lookup List Examples: The Display Data As list field options are shown below, along with an example of each:
|
|
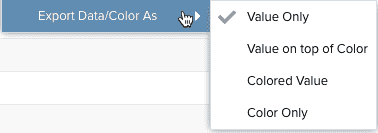
Export Data/Color As If you plan to export a report/entity grid that makes use of lookup list values that render color and/or icons, this options lets you specify how to treat the value/color when exporting. Note that icons cannot be exported as they only exist within PPM Pro.
|
Options are (see Display Data As, above, for examples):
|
|
Note: You can format numeric data values of non-list reports by using the Field Options modal. The following number types can be formatted with the Display Data As menu item: Percent Choose to show decimals or round to whole number.
Float Choose to show decimals or round to whole number.
Money Choose no decimals, 2 decimal places, thousands (k) and millions (M) representatives.
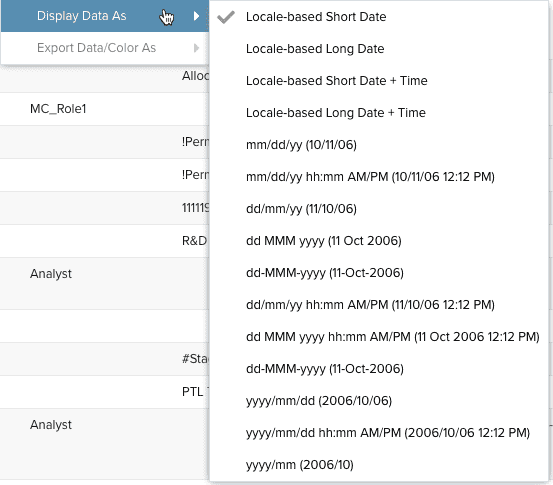
Choose from a large variety of date and date/time formats. Remember that as you choose a format it renders immediately in the Preview Pane, so try out different options. The date format examples are represented in each option label.
|
Values round up using conventional rounding standards - round up at a value of 5 or higher. Understanding the rounding is important when choosing the level of precision you want to use.
Percent Example: 32% or 32.36%
Float Example: 432 or 432.05
Money Examples: $0k $0.00k $0M $0.00M
|