About Reports (Legacy)
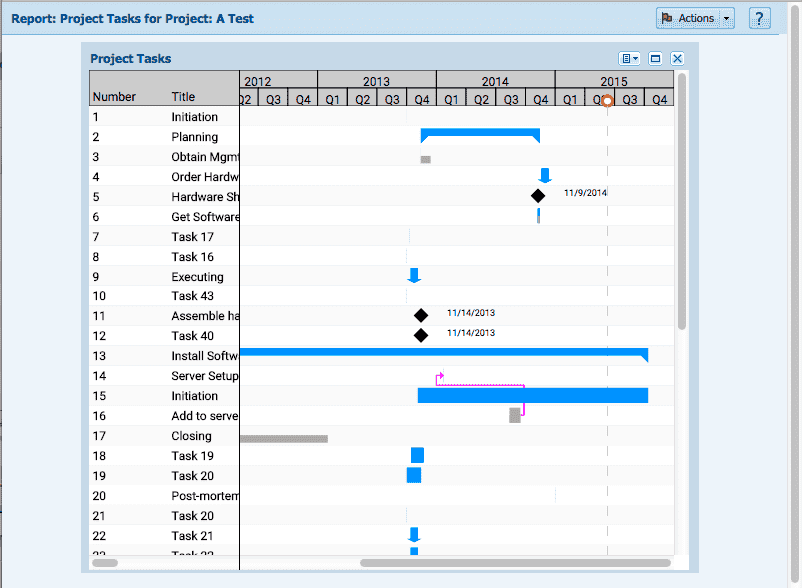
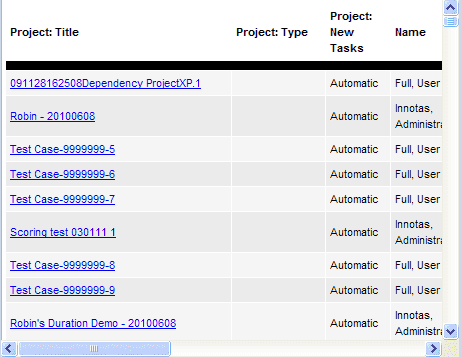
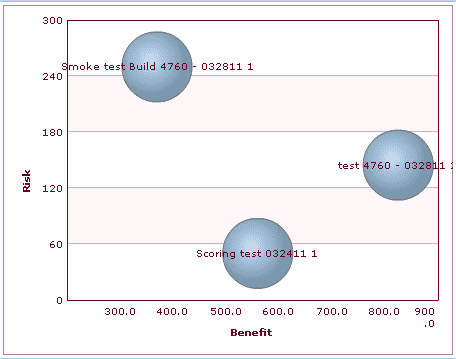
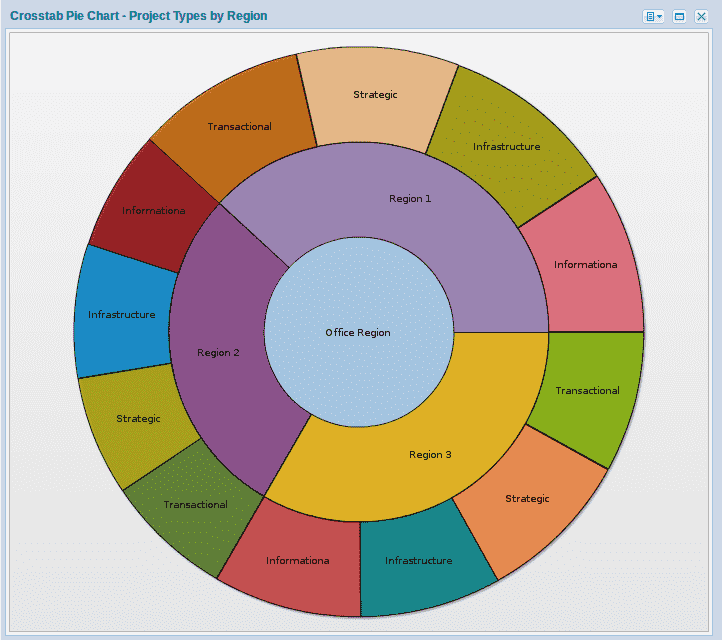
PPM Pro provides a robust reporting infrastructure to help you create the following types of reports:
-
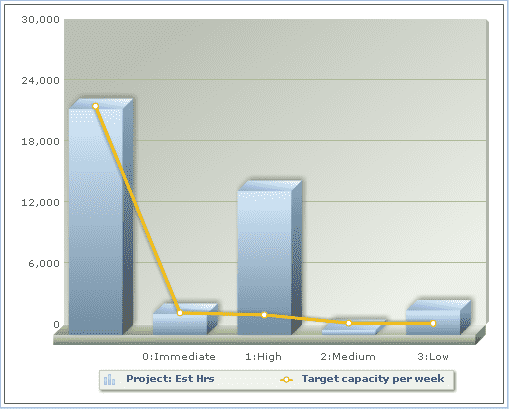
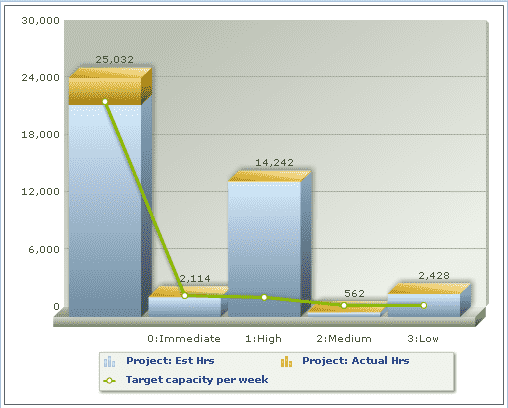
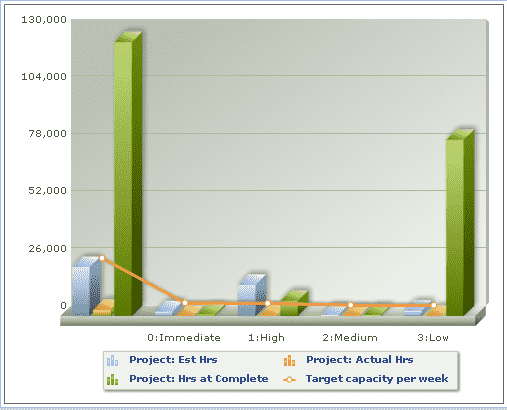
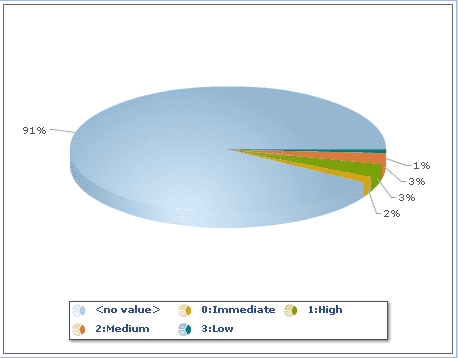
Crosstab - list, multi-series column, pie
-
Column - simple, stacked, and multi-series
See below for an example of each report type.
A Report wizard guides you through the creation of sophisticated IT governance reports. With one report definition, you can generate multiple types of reports. This streamlines report development and cuts down on the proliferation of report definitions. You can tweak your report and generate results right in the wizard, promoting rapid report construction and modification.
PPM Pro provides an extensive set of report templates that access the data already in your system. You simply choose a template as a starting point, and then configure the exact data and layout you want.
Once reports are ready, you can publish them in PPM Pro dashboards, allowing you to present vital organizational information to collaborators and decision-makers. See About Dashboards for more information.
You can control access to reports with multiple options, including Report Teams for group sharing.
In addition to the different report types, you can export report output to Excel and CSV. You can export Gantt charts to PDF. You can download Pie, Bubble, and Column charts in JPEG, PNG, PDF, or SVG formats.
How to get started
Start by familiarizing yourself with the Reports tab (Working with the Reports List page), and then read Overview of report creation.
See About the Report wizard to learn about the mechanics of creating a report.
If you are ready to start creating a report, go directly to the first step, Choosing the report source.


