Time Series Reports
The report Specialty list includes a Time Series option that enables you to report on field data that changes over time or has contours. The Time Series specialty is available for the following report topics:
- Allocated Role
- Financial Entry
- Portfolio
- Project
- Resource
- Role
- Role Group
- Task
- Task Role
- Task Schedule
- Timesheet Entry
Things to Know
- When you pick a topic and the Time Series specialty, a set of special fields become available for use in the report. These fields are found on the Data tab's Available Fields list, and are indicated with a suffix (Time Series). Use these fields to configure your time series reports. NOTE that (Time Series) fields should be selected ONLY from the main report topic fields or one of the "Specialty" field paths; do not select (Time Series) fields from lower level field path entities that are not "Specialty" as the resulting data may not be accurate or unrepresented. For example, if you choose the Project topic, make sure that the (Time Series) fields are chosen from the Project available fields, Resources (Specialty) available fields, or Roles (Specialty) available fields.
- Date (Time Series) field - This Date field is required and is dropped into the data bucket when selecting fields on the Data tab. This Date field does not correlate to any specific date field, but rather maps to whatever is meaningful to the Topic. This field is absolutely needed if you choose to use the List: Basic report type.
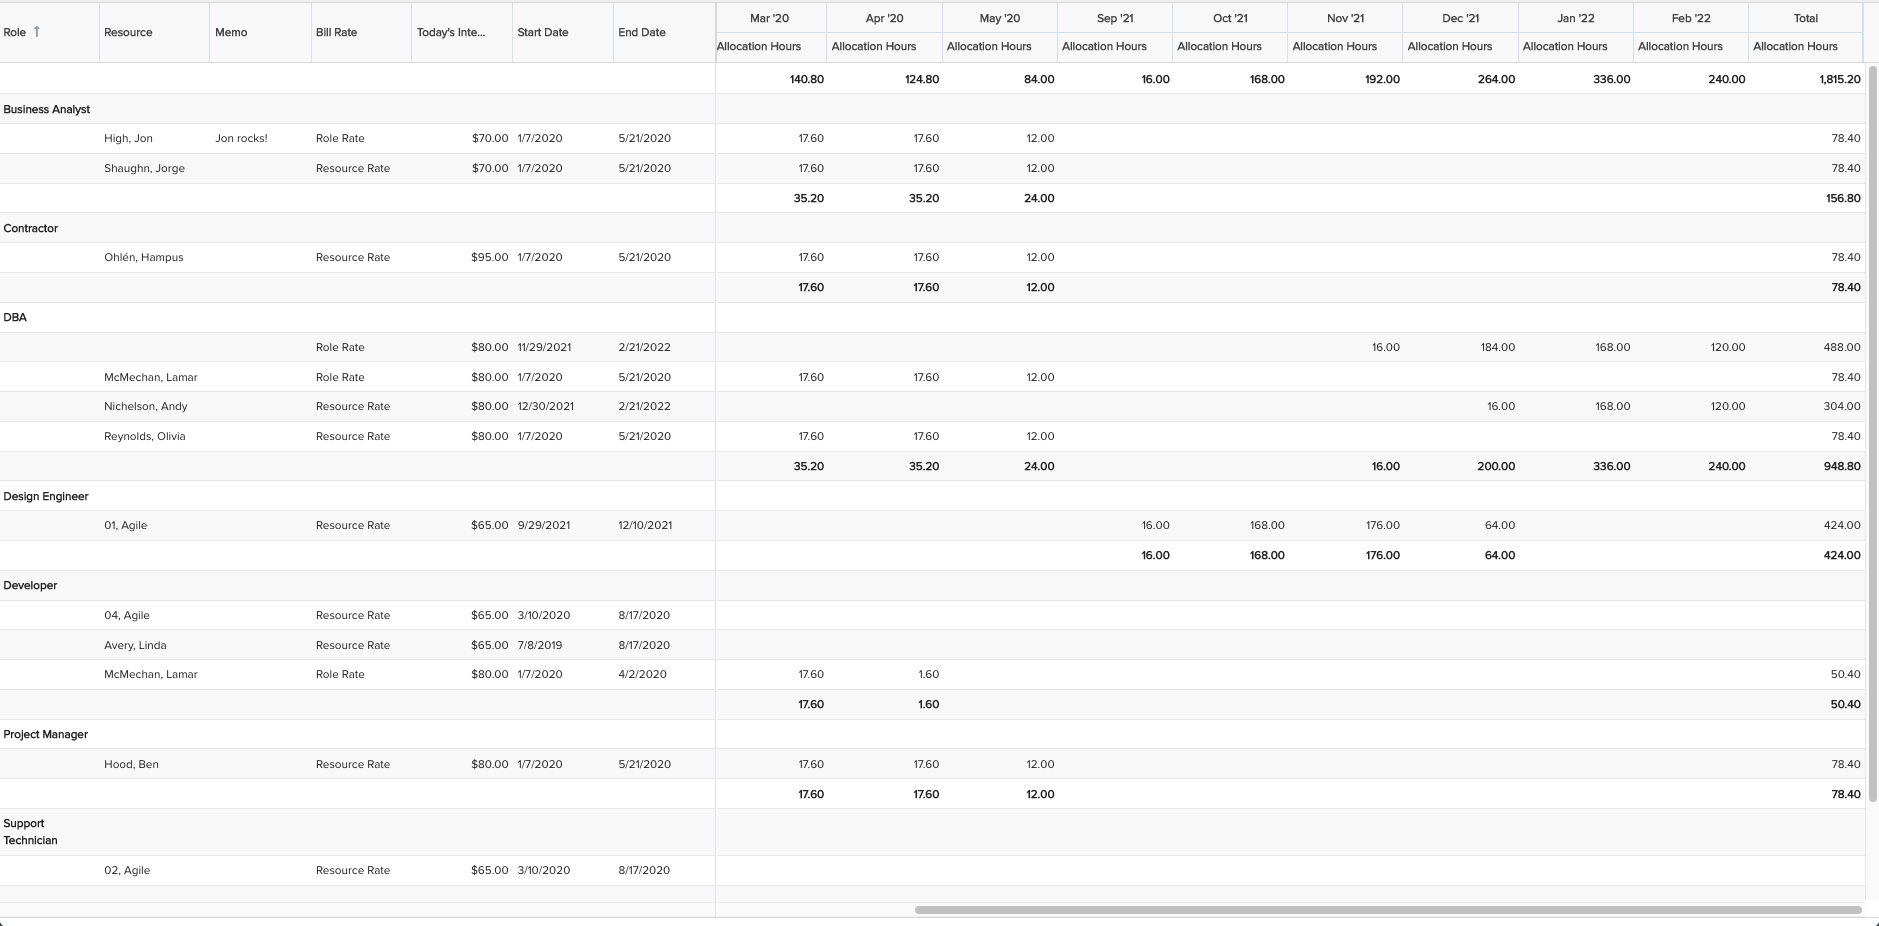
- List: Time Series - This output type allows you to build a time series report for a kind of Crosstab without the top axis. A list of non-contoured values appears on the left, with a corresponding contoured section on the right. You can basically take a row of data and incorporate it into a Time Series - each row of entity data has an associated row of contoured values. For example, imagine your report topic is Project, and you include the project fields Title, Status, and Owner (they appear on the left side), and for each one of these rows the right side displays the project's monthly totals of forecasts and actuals. This is useful if you don't need grand and subtotals, don't need top axis, just want the benefits of a list report.
- Conditional background color can be applied time series reports (any numeric field).
Building Blocks
Time Series building blocks shown below. Headings and data value formatting also available as with any report, but not shown below. See Display Tab for information about formatting reports.
|
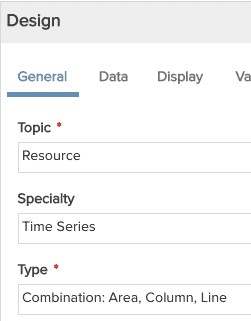
1. Choose the report Topic and Specialty/Time Series |
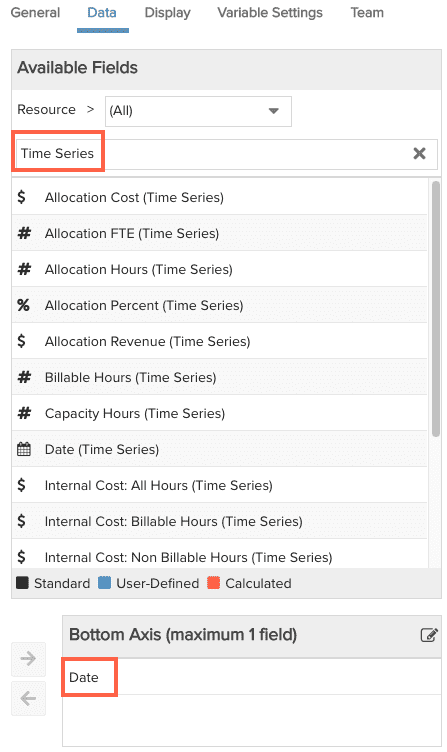
2. Select the Available Fields - note that the Date field is put in the Bottom Axis section by default because it is required. (Hint: filter by Time Series to display all time series fields)
|
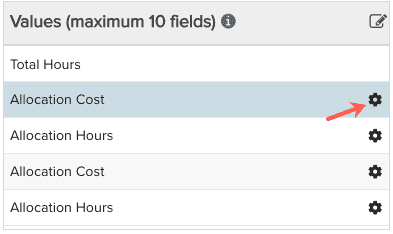
3. Configure field settings You might have noticed that some of the data fields you selected for your report have a gear icon
|
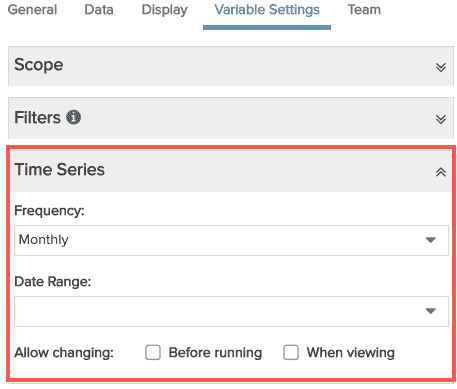
4. Configure the Time Series frequency and date range: The default frequency is Monthly with no Date Range. Specifying a Date Range will ensure you get the time series you want with a side helping of quick rendering. If you do not specify a Date Range, data will be returned relative to the current date - one year before through one year after. |
Configuring Time Series Fields
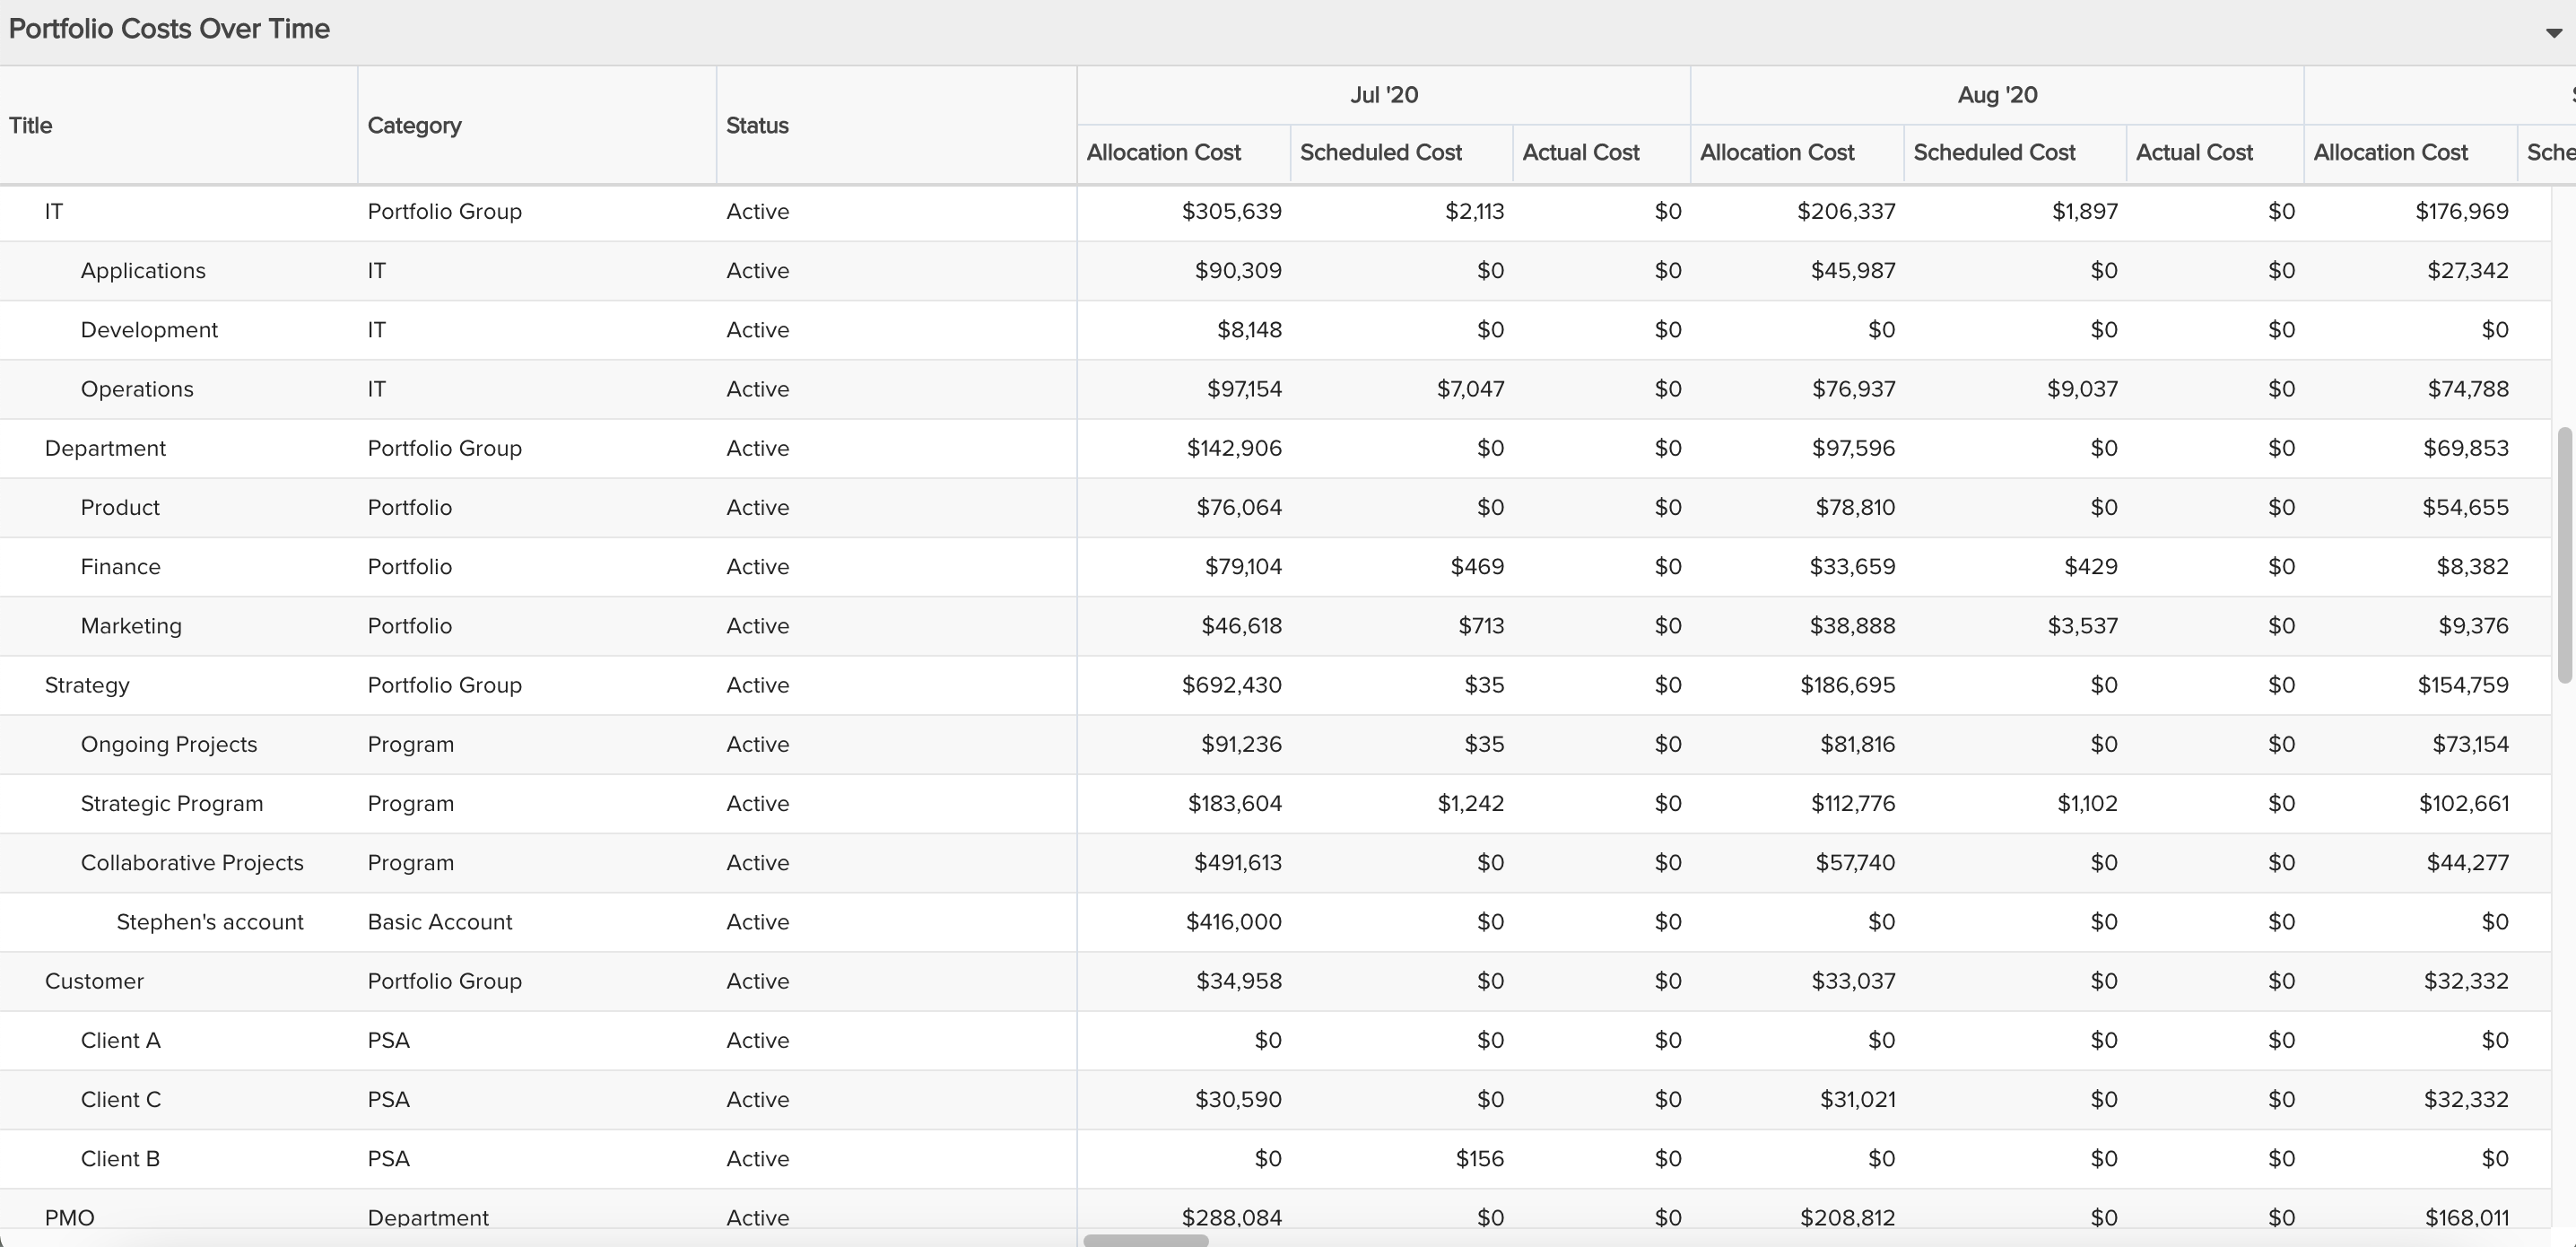
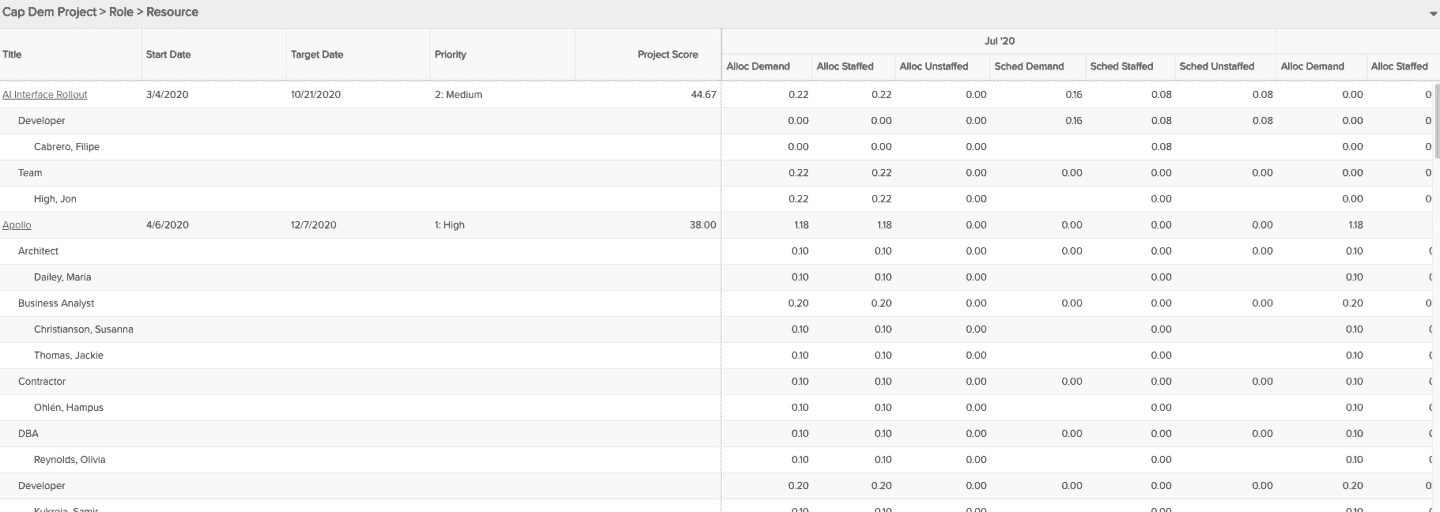
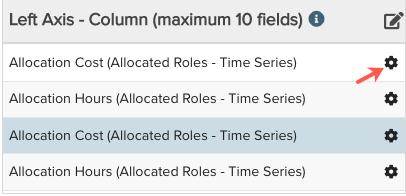
As described above, certain fields can be filtered by different properties/constraints. For example, Allocation Costs can be scoped down to Staffed/Unstaffed resources or Capitalized/Non-capitalized costs. Rather than littering the Available Fields list with an over-abundance of variations, instead you can put the same field in your data list multiple times, and then change its properties/constraints as necessary. For example, the screen below left shows several instances of Allocation Cost and Allocation Hours, each has a gear icon  next to it. Click the icon to show the Edit Settings for Allocation Cost (in this example) (screen below right). For example, you can rename Allocation Cost to "Demand Cost" and for the other Allocation Cost field select "Staffed". See examples below.
NOTE
Note that the filters discussed here (Staffed/Unstaffed, Billable/Non-Billable) are provided by the system. If you want to break down your data in a more granular fashion, you can use field-level filters, which allow you segment your data by any aggregatable (numeric) field. See Field-Level Filters.
|
Before configuring:
After configuring, can represent (see configuration dialogs in the right column):
|
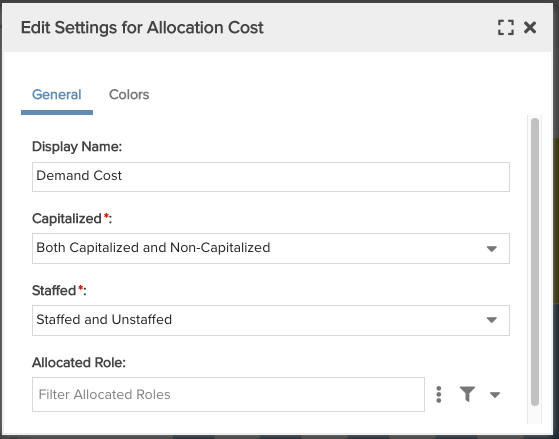
Examples Retitle Allocation Cost to "Demand Cost", and filter by "Staffed and Unstaffed"
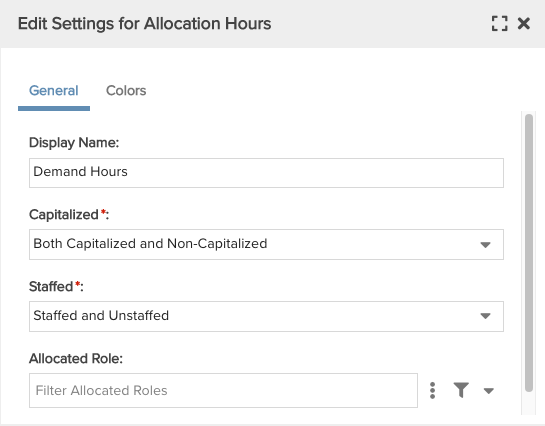
Retitle Allocation Hours to "Demand Hours" and filter by "Staffed and Unstaffed"
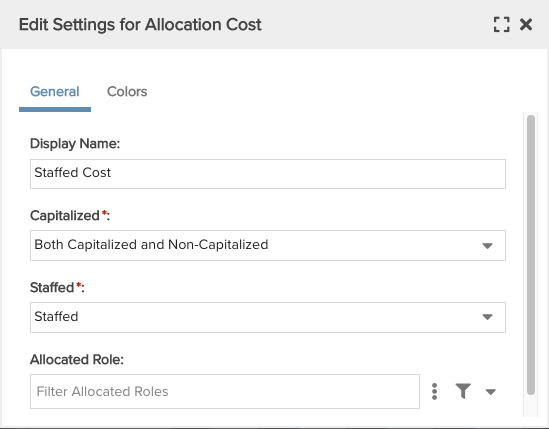
Retitle Allocation Cost to "Staffed Cost" and filter by "Staffed"
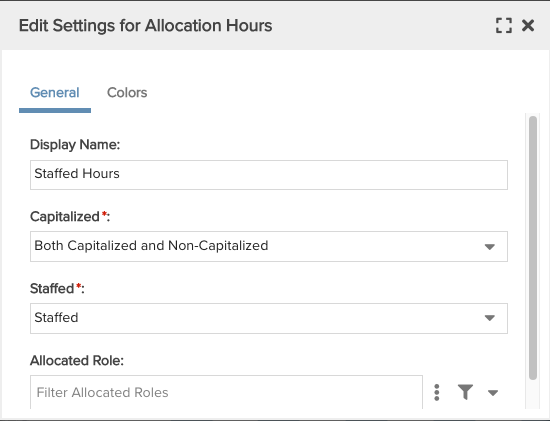
Retitle Allocation Hours to "Staffed Hours" and filter by "Staffed"
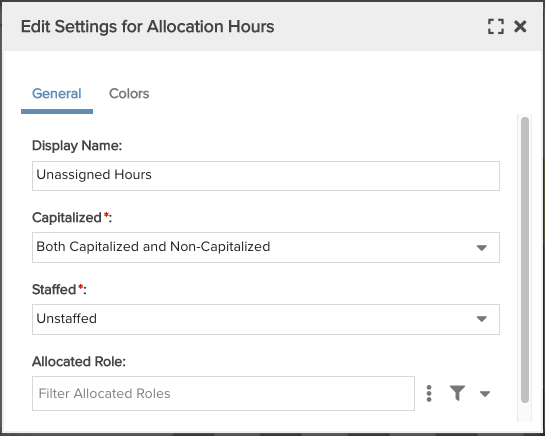
Retitle Allocation Hours to "Unassigned Hours" and choose "Unstaffed"
|
Configuring Conditional Background Colors
The Edit Settings dialog has 2 tabs: General and Colors. The Colors tab is available only for percent and numeric fields.
- The General tab is where you edit the Display name of the field and configure field-level filters.
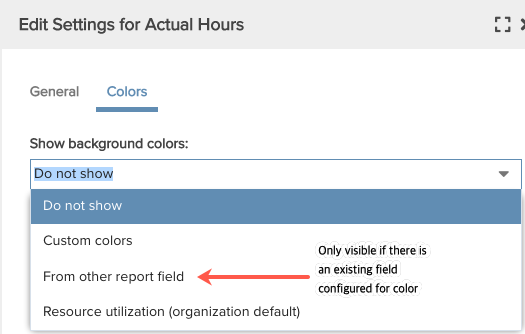
- The Colors tab is where you create a conditional background colors for numeric fields. If a custom color already exists, you can reuse it. When you click the color tab, you'll see three or four menu options (see below) - by default, background colors are not displayed (Do Not Show).
Setting Up a Custom Conditional Background Color
When you select Custom colors from the drop list, the following modal appears. Configure the color as described below:
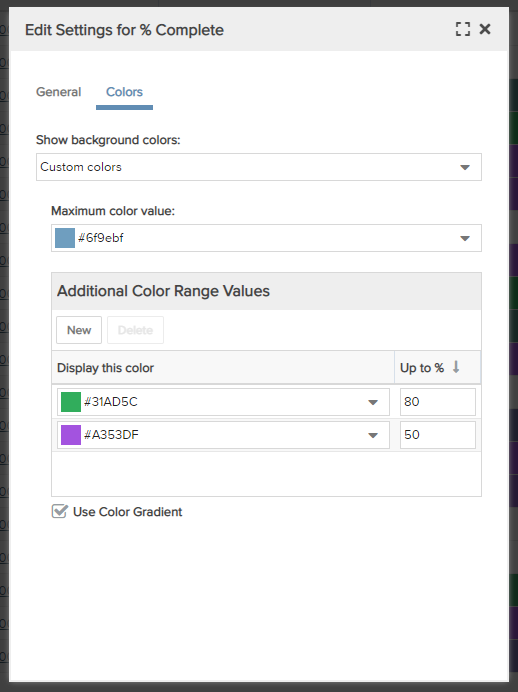 |
Show background colors: Determine if and how to use color.
Maximum color value: This color initially defaults to the first color in the Organization Color Palette lookup list normally used when a field has a value. The color displays when the highest value in the Additional Color Range Values is exceeded. If no Additional Color Range Values are configured, this color will always be displayed. Additional Color Range Values: This component allows you to configure one or more percent ranges, each of which is associated with a color.
Measurement Field: For non-percent numeric fields, provides the denominator for the calculation on the field that will result in a percentage for the color range. Use Color Gradient: Check this box to to use a color gradient in the field background. |
Setting Up A Custom Conditional Background Color
When you select Custom colors from the drop list, the following modal appears. Configure the color as described below:
|
Show background colors: Determine if and how to use color.
Maximum color value: This color initially defaults to the first color in the Organization Color Palette lookup list normally used when a field has a value. The color displays when the highest value in the Additional Color Range Values is exceeded. If no Additional Color Range Values are configured, this color will always be displayed. Additional Color Range Values: This component allows you to configure one or more percent ranges, each of which is associated with a color.
Measurement Field: For non-percent numeric fields, provides the denominator for the calculation on the field that will result in a percentage for the color range. Use Color Gradient: Check this box to to use a color gradient in the field background. |