Tiles
This report shows any number of simple numeric aggregated values for an entity field. You can show a single numeric field within a report as shown by the 6 example Tile reports below:

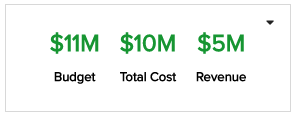
You can also show different numeric fields within a single report as shown by the single Tile report with four fields below:
You can build these reports using the design settings in the table below. Alternatively, you can download this single Active Projects tile report definition or download this multiple Key Financials tile report definition and upload to your PPM Pro instance.
| Design View | Selection | Comments |
|---|---|---|
| General |
Topic: Project Type: Tile Title: <enter a meaningful title>
|
You can create a Tile report for any entity by changing the Topic, for example to portfolio, task, project log, and so on. This example is for project numeric fields. |
| Data |
List Fields: Whichever of the following and other numeric fields would be of value, for example standard, user-defined, or calculated numeric fields such as:
|
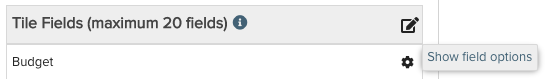
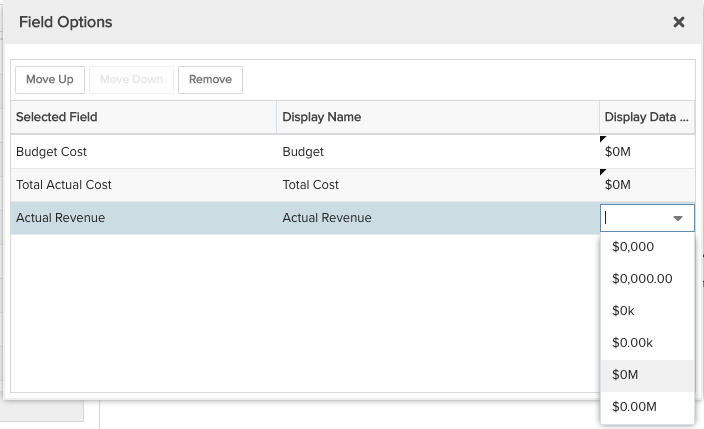
To change the field title/heading value Display Name and Display Data As options, you can use the Field Options modal.
|
| Display |
Configure desired options within the Display tab, such as Headings, Data, Drilldown, and Aggregation.
|
Note that if you want to have different fonts, styles, sizes, and colors per selected field, you will need to create a Tile report per field; fields within the same Tile report will use the same Display options.
|
| Variable Settings |
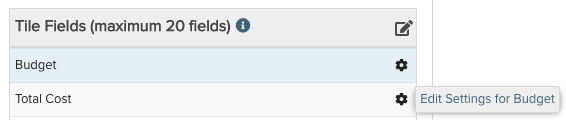
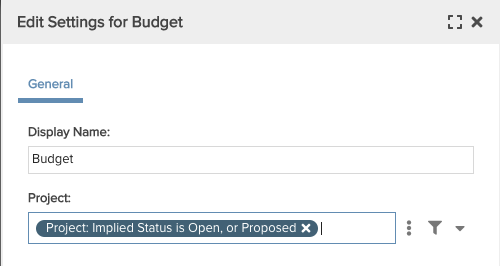
Scope: Portfolio Filters: optionally include project filters NOTE: If you have multiple fields within a single tile report and you need to set individual field-level filters, in the Data tab next to each field in the Tile Fields list, click the gear icon to edit settings for the field and add an appropriate filter:
|
Selecting the Portfolio Scope will cause this report to be available on Organization Report or Portfolio Report grids and subsequently can be added to relevant Dashboards. You can select other Scope options if you want this report to be shown in other entity grids as well, such as Organization to run across all projects. As needed, you can also include Filters. If you want to allow the user to change to a different Scope and/or Filter before running the report or when viewing the report, select the relevant checkboxes for Allow changing. |