Project Financials by Business Objective for a Portfolio
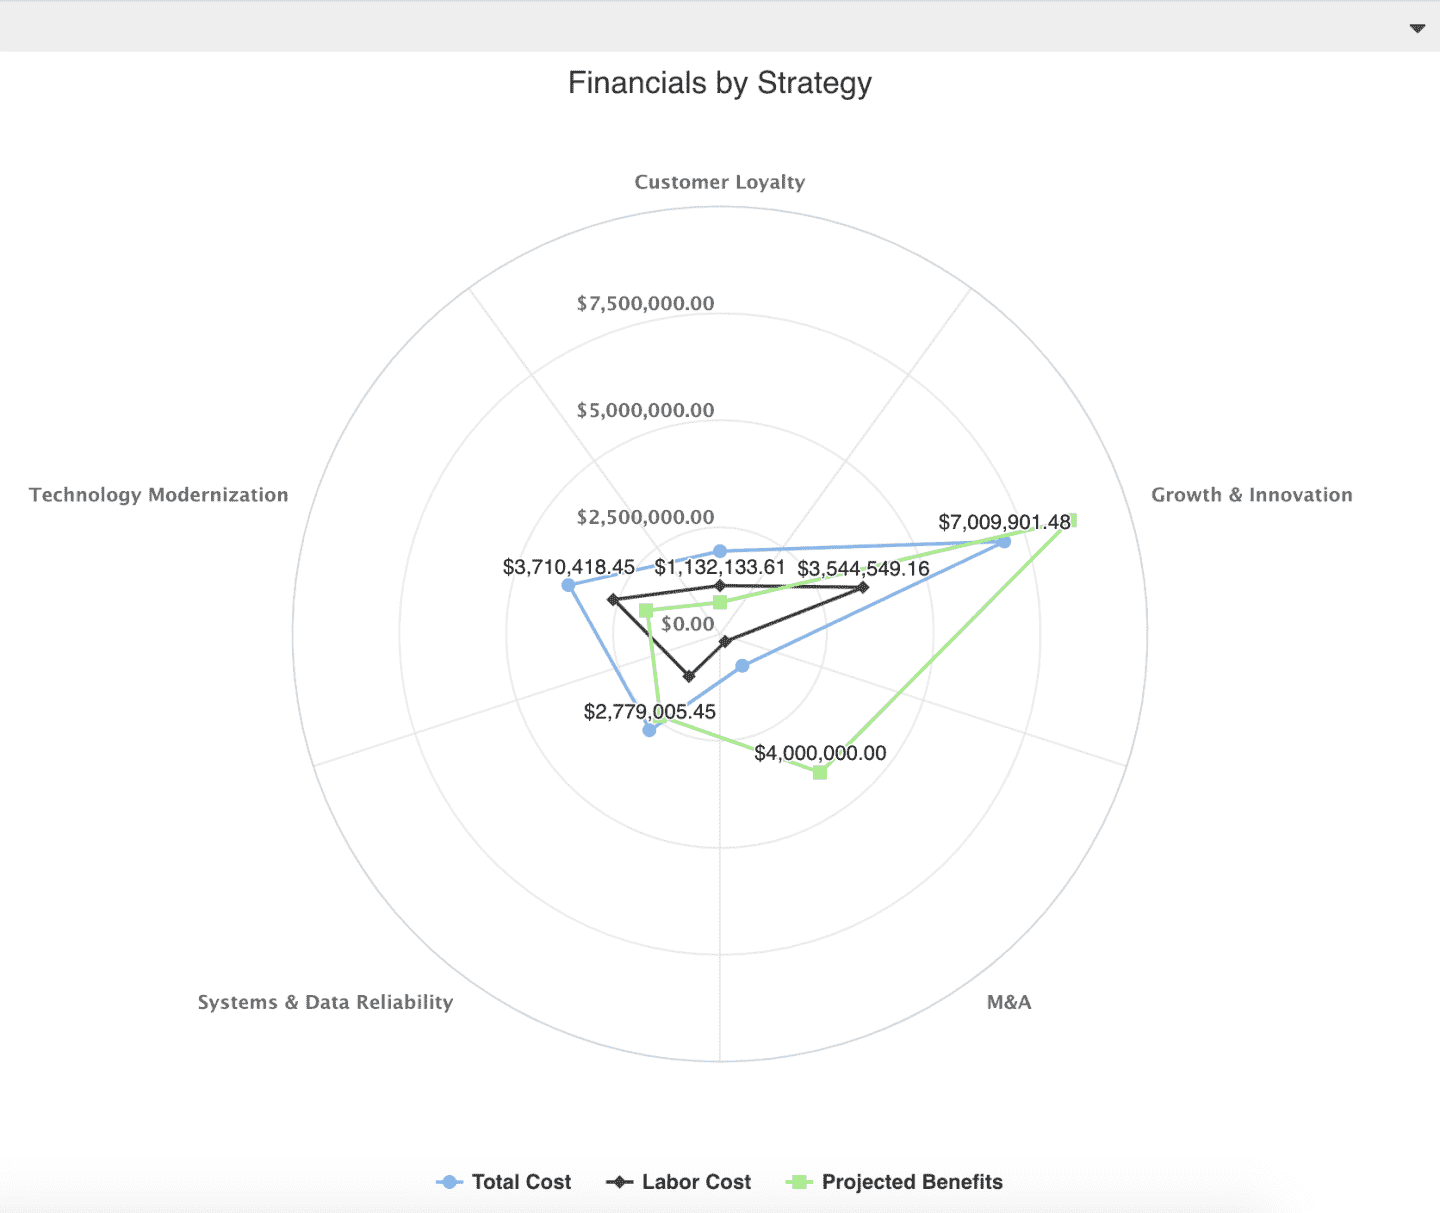
This report gives you a visual picture of various financial costs and revenue values given a specific project property, for all projects in a portfolio. For example, see a spiderweb showing financials of Total Cost, Labor Cost, and Projected Benefits, summarized by a project property such as Business Objective, for all projects in a portfolio. You can build this report using the design settings in the table below. Alternatively, you can download this report definition and upload it to your PPM Pro instance. Please note that if you download the report definition file, when you upload it then this user-defined field "Business Objective" will not be in your instance and you will need to select a Group By field in the resulting report.
| Design View | Selection | Comments |
|---|---|---|
| General |
Topic: Project Type: Spiderweb Title: <enter a meaningful title>
|
Other report Types that work well include Area: Basic, Bar: Basic, Column: Basic, and Line. If the selected financial data fields do not overlap, then the Area: Stacked, Bar: Stacked, and Column: Stacked may also be of interest. |
| Data |
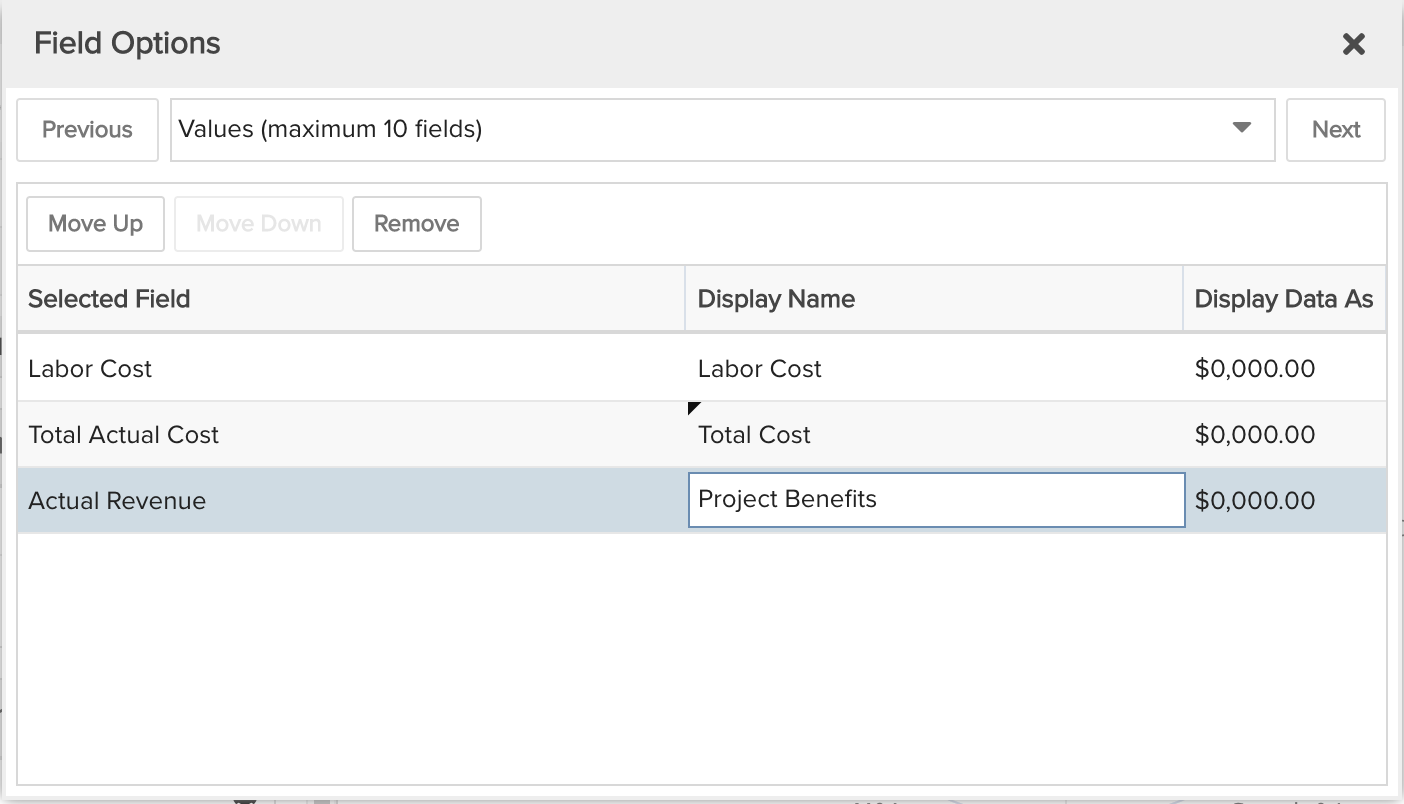
Group By: <1 discrete project field, such as a lookup list for Business Objective, Priority, Status, and so on> Values: <up to 10 financial fields, such as Total Actual Cost, Actual Revenue, Labor Cost, and so on> To change the data field Display Name or Display Data As, for example from "0,000.00" to "0,000", within the Values area title select the edit icon for "Show Field Options" and in the resulting "Field Options" modal, edit the field options.
|
Per above, if the selected fields are complementary and do not overlap, you could use a Stacked report Type. Otherwise you would want to use a Basic report Type. This report is an example showing a user-defined field "Business Objective" that is a lookup list. Please note that if you download the report definition file, when you upload it then this user-defined field will not be in your instance and you will need to select a Group By field in the resulting report. |
| Display | Set desired Display options. | |
| Variable Settings |
Scope: Portfolio
|
Selecting the Portfolio Scope will cause this report to be available on Portfolio Report grids. You can select other Scope options if you want this report to be shown in other entity grids as well. As needed, you can also include Filters. If you want to allow the user to change to a different Scope and/or Filter before running the report or when viewing the report, select the relevant checkboxes for Allow changing. |