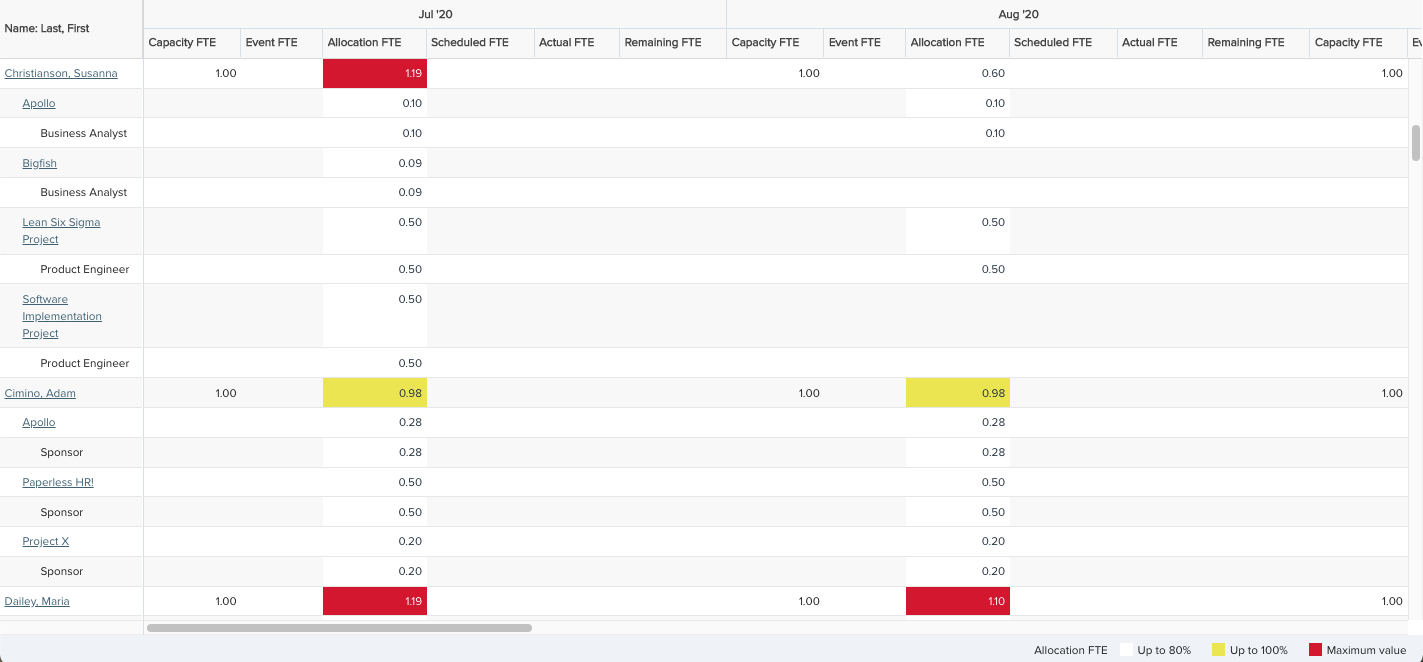
Capacity and Demand Resource-Project-Role
Shows a capacity and demand report with levels of resource, project, and role, for capacity, event, allocated, and scheduled hours/FTE. You can build this report using the design settings in the table below. Alternatively, you can download this report definition and upload it to your PPM Pro instance.
| Design View | Selection | Comments |
|---|---|---|
| General |
Topic: Resource Specialty: Time Series Type: List: Time Series Title: <enter a meaningful title>
|
Note that for reporting on capacity and demand with time series data, the List: Time Series is the best report type to use, especially with the merge columns capability. |
| Data |
Note that the '(Specialty)' field path is absolutely needed to arrive at the levels of Resource, then Project (Specialty), then Role (Specialty), using the merge columns (Display details below) as needed. List Fields: Add whichever of the following resource fields and others that would be of value, such as:
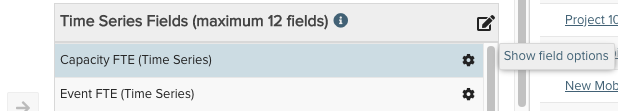
Time Series Fields: Only available fields that have a time series indicator appended to their titles - such as '(Time Series)', or '(Allocated Roles - Time Series)' - should be added to this section (hint: search Available Fields list for 'time series'). See Capacity & Demand Reporting for field paths and field definitions to help you in your field selection. Note that all time series fields must be selected from the main topic field path. For example, from the Resource available fields add the following:
|
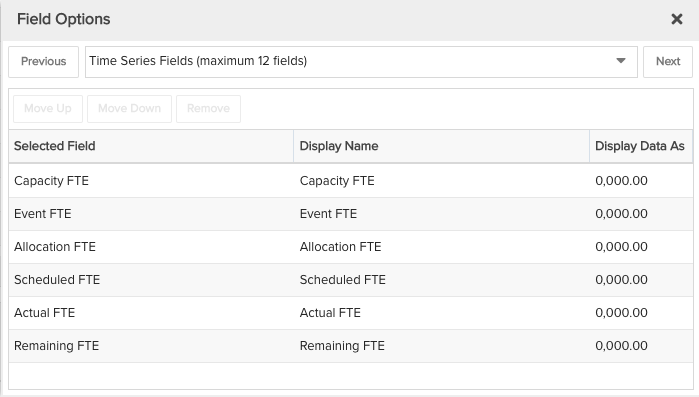
To change the data field Display Name or Display Data As, for example from "0,000.00" to "0,000", within the List Fields or Time Series Fields area titles select the edit icon for "Show Field Options" and in the resulting "Field Options" modal, edit the field options.
|
| Display |
Configure desired options within the Display tab, such as:
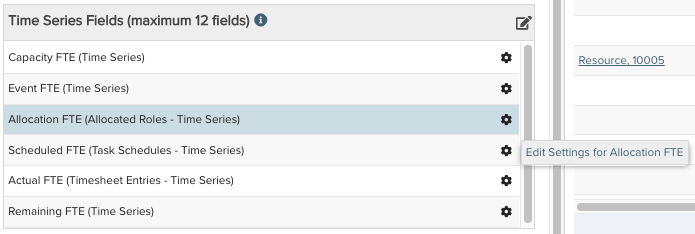
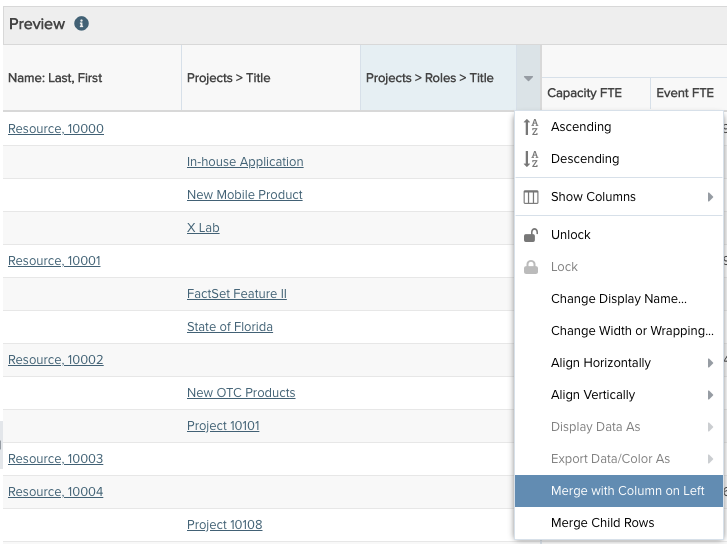
Within the Preview pane, to merge columns similar to how the Capacity & Demand user interface reports appear, select a column's options menu and "Merge with Column on Left" to merge it with its left neighbor column. Tip: To merge multiple columns, it is best to start with the furthest right column and merge one by one to each neighboring column on the left. For example, merge the Roles title column with the Projects title column, and then merge that newly merged column with the Resource name column. Adding Background Colors: Within the Time Series Fields area select the gear icon to edit settings for the field you want to have the background color vary:
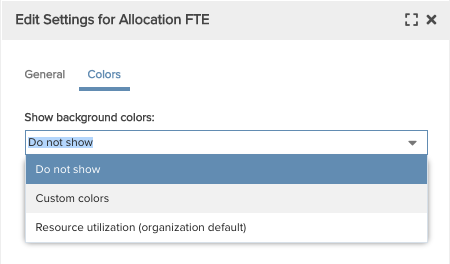
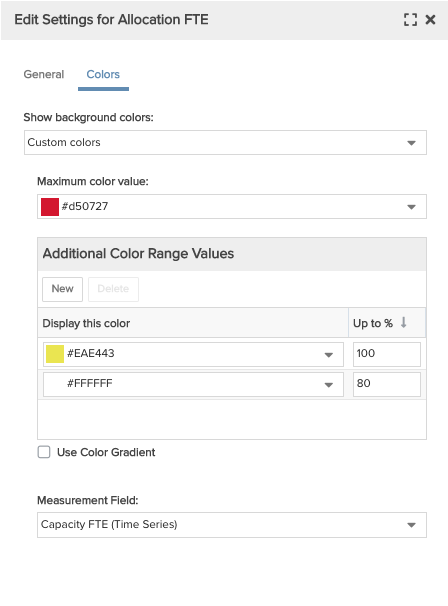
Select the Colors tab and the Custom colors option:
Select an appropriate Maximum color value (this is the background color shown for % values greater than the largest 'Up to %' value in the grid below) and add New colors with 'Up to %' values. 'Up to %' is inclusive of the value, for example if you select a white color for up to 100% and a blue color for up to 75%, then values greater than 75% and up to and including 100% will have a white background. For example, for the Allocated Demand field you can select a Maximum color value of red, add an Additional Color Range Value of yellow with Up to % of 100, and an Additional Color Range Value of white with Up to % of 80:
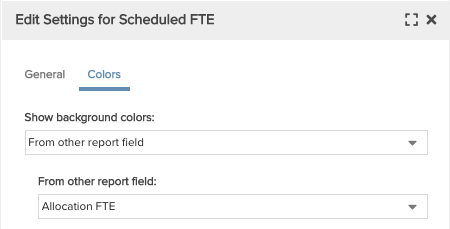
NOTE that if the field is not a percent, you will also need to provide a Measurement Field (the original field is converted to a percentage by dividing its value by the Measurement Field value). You can add Custom colors to other fields. Or, if you'd like to use the same Custom colors across multiple fields, then configure Custom colors for one field and select "From other report field" for the Show background colors option and also the desired field for the From other report field option:
|
 |
| Variable Settings |
Set desired Time Series options, providing filters and dates as possible to reduce the time it takes to render the report, such as: Scope: Select Organization and Resource if you want the report to be available to be run from those report grids Filters: Any resource, project, or role filters Time Series: Select a Frequency and Date Range appropriate to your report needs |
If you would like to allow changing Filters or the Time Series selections before running the report or when viewing the report, select the 'Allow changing' checkbox options for each. |