Planview named a Leader by ForresterPerfect scores in 12 of 22 criteria and ranked highest overall in Current Offering in The Forrester Wave™: SPM Tools, Q2 2026.Read the report →
UX research labProvide feedback on upcoming features and help shape more intuitive, user-friendly solutions through direct participation in user studies.Learn more →
Success acceleratorFlexible expert support to boost adoption, apply best practices, and help your team get the most from Planview.Learn more →
Check Planview system statusesCheck live Planview system health, uptime status, and scheduled maintenance details to stay informed.View statuses →
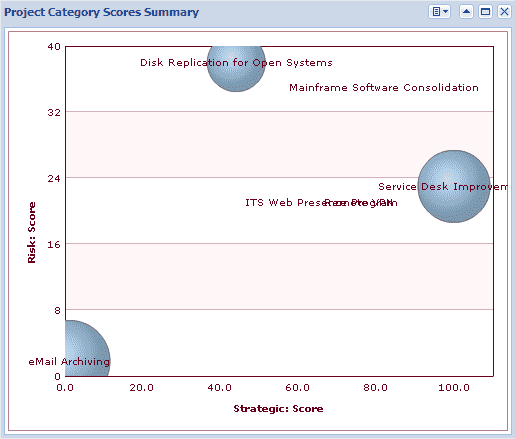
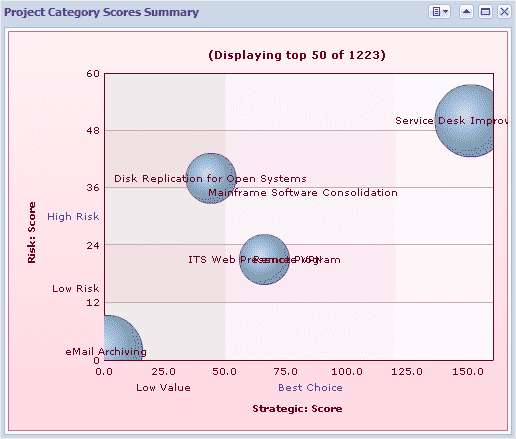
Example Bubble Chart Last updated Save as PDF Category Field (X Axis) - Strategic:Score Category Field (Y Axis) - Risk:Score Data Series Field - Bubble Size - Project:Hrs to Complete Bubble chart with zones Two Y axis zones - Low Risk, High Risk Two X axis zones - Low Value, Best Choice