Running and Viewing Dashboards
This topic covers:
- Runtime Actions menus
- running and rerunning unpublished dashboards
- viewing and rerunning published dashboards
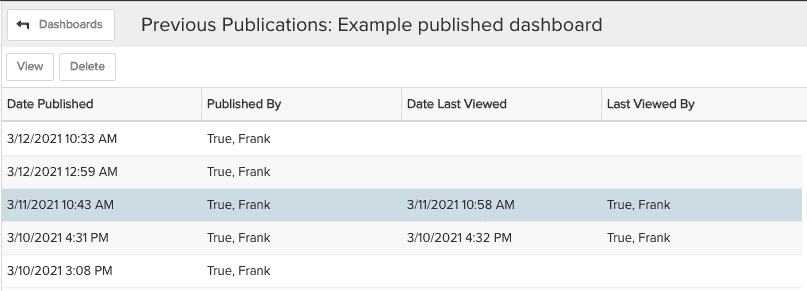
- viewing previously published dashboards
- viewing/editing dashboard components
- exporting reports and dashboards
See also Viewing Published Dashboards.
Runtime Actions Menus
A rendered dashboard and each of its components have an Actions menu.
- The component Actions menu is where you choose how to export/print the individual component.
- The dashboard Actions menu is where you choose how to export/print the entire dashboard (including all components), as well as how to rerun the dashboard. You can also view a list of all dashboard content and possibly adjust filters and other variables. See Viewing/Editing Dashboard Content List, below.

Running Unpublished Dashboards
You can run any existing dashboard that you have access to view on the top-level Dashboards list or entity-level Dashboards list page.
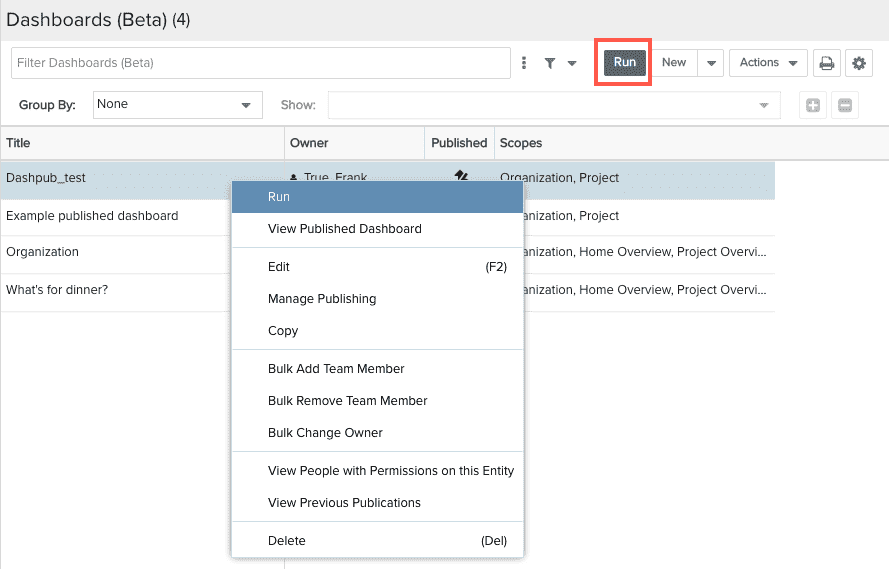
To run an unpublished dashboard, select the dashboard and click the Run button. Or, double-click the dashboard, or right-click the dashboard and choose Run from the context menu.
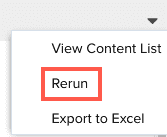
Non-published dashboards are run as the current user, which means that the data the user sees is determined by their permissions. The current user can refresh the dashboard (with data informed by their permissions) by selecting "Rerun" from the Actions menu in the rendered dashboard.
|
Run
|
Dashboard Actions menu
|
Viewing Published Dashboards
To view a published dashboard, select a published dashboard (indicated by the ![]() or
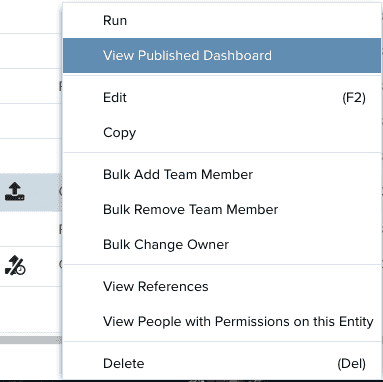
or  icons) and choose Actions > View Published Dashboard (or select the dashboard, right-click and choose View Published Dashboard from the context menu). Also, you might view a published dashboard by clicking a URL/link distributed to you by way of an email notification.
Published dashboards are always run as the dashboard publisher - the data returned is determined by the publisher's permissions and is a snapshot of data at the time of publication. Note that double-clicking the published dashboard just runs it (does not render a published version).
The current user can rerun a published dashboard:
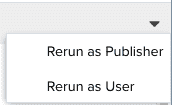
- Rerun as publisher, which will refresh the rendered data locally, according to the publisher's permissions.
- Rerun as user, which will refresh the rendered dashboard locally, according to the current user's permissions. This is useful if, for example, you want to scope down the data displayed to just what is relevant to you (according to your permissions).
Neither rerun action will affect the original published dashboard (remains the same until it is republished).
|
View published
|
Published Dashboard's Actions menu
|
Viewing Previously Published Dashboards
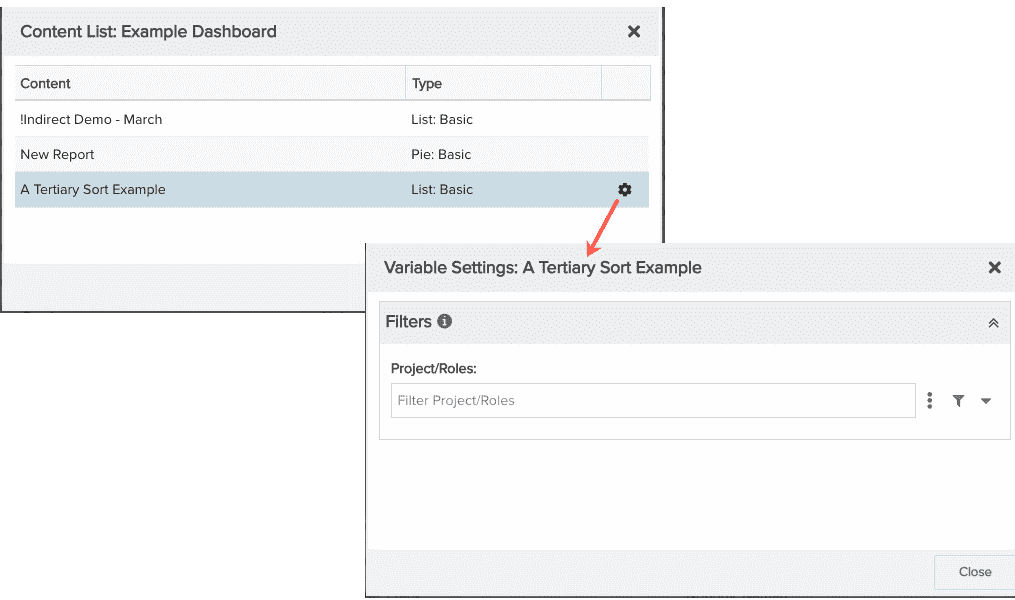
Viewing/Editing Dashboard Content List
You can view a list of all report components that comprise a dashboard by choosing dashboard Actions > View Content List. Any component with a gear icon has a variable setting(s) that you can adjust. You can also access any components that are configured with variable settings viewing the dashboard. For example, in the modal below there are three report components. The screenshot below shows the list of components, their output type, and a gear icon indicating there are variable settings (a filter in this example) for the component "A Tertiary Sort Example":
