
Resources - Allocated vs Capacity Hours Time Series
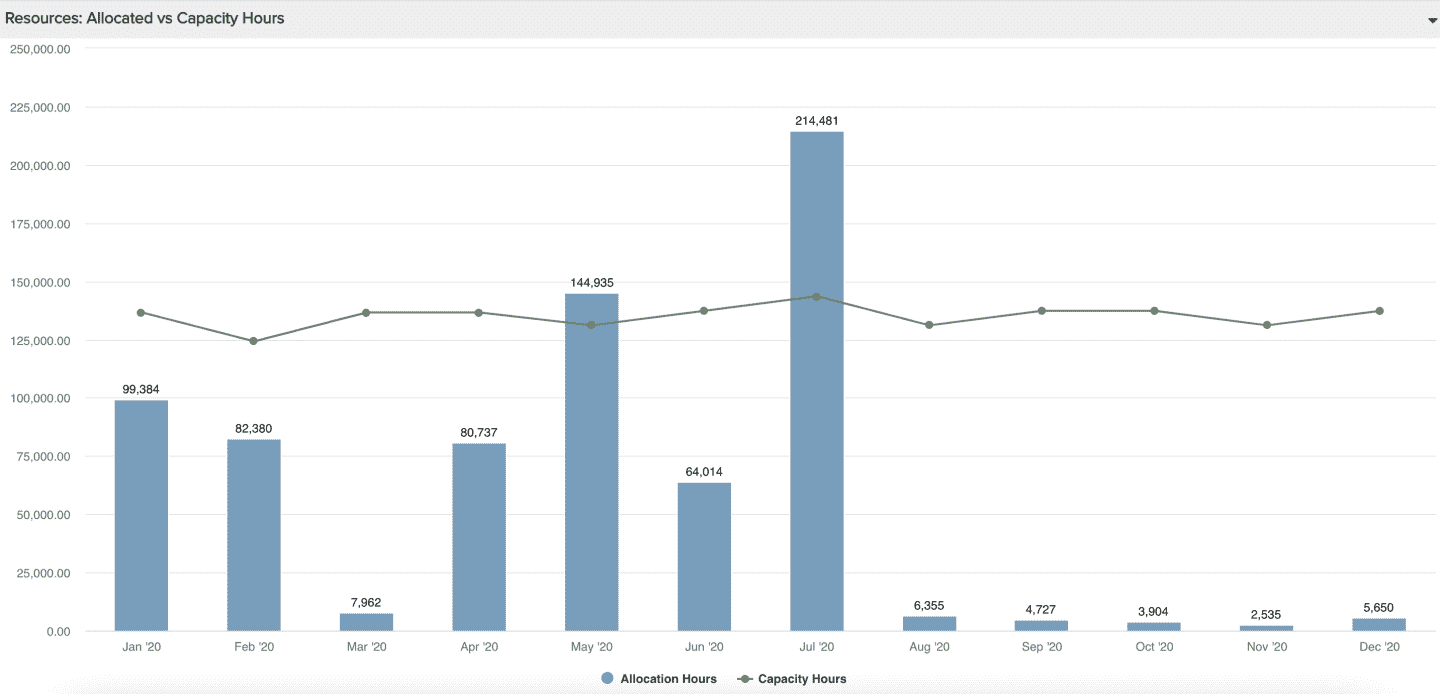
This report shows you resource allocated hours as columns and capacity hours as a line over a time range. You can build this report using the design settings in the table below. Alternatively, you can download this report definition and upload it to your PPM Pro instance.
| Design View | Selection | Comments |
|---|---|---|
| General |
Topic: Resource Specialty: Time Series Type: Combination: Area, Column, Line Title: <enter a meaningful title>
|
Other report Types that work well include Area: Basic, Bar: Basic, Column: Basic, and Line. If the selected data fields do not overlap, then the Area: Stacked; Bar: Stacked; Column: Stacked; and Combination: Stacked Area, Stacked Column, Line may also be of interest. |
| Data |
Bottom Axis: Date (Time Series) Left Axis - Column: Allocation Hours (Allocated Roles - Time Series) Left Axis - Line: Capacity Hours (Time Series) |
|
| Display |
Set desired Display options, such as: Data - Data values: Show |
|
| Variable Settings |
Set desired Time Series options, such as: Frequency: Monthly Date Range: Is this year |
Provide relevant filters, for example if you only want to see roles for certain types or for a specific unit. If you want to allow the user to change to a different Filter before running the report or when viewing the report, select the relevant checkboxes for Allow changing. |