
Using the Task Gantt Chart
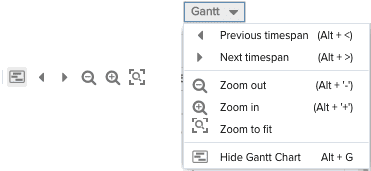
When you click the ![]() button to show the Gantt chart (or choose Show Gantt Chart from the Gantt menu), the Gantt tools become active. Each graphical tool has an equivalent menu item in the Gantt menu.
button to show the Gantt chart (or choose Show Gantt Chart from the Gantt menu), the Gantt tools become active. Each graphical tool has an equivalent menu item in the Gantt menu.
Gantt Settings
Click the settings icon ![]() to display the Gantt Settings dialog. The configure columns tab is where you choose the fields to display on the task list. You can reorder the fields here, or simply drag and drop them on the grid.
to display the Gantt Settings dialog. The configure columns tab is where you choose the fields to display on the task list. You can reorder the fields here, or simply drag and drop them on the grid.
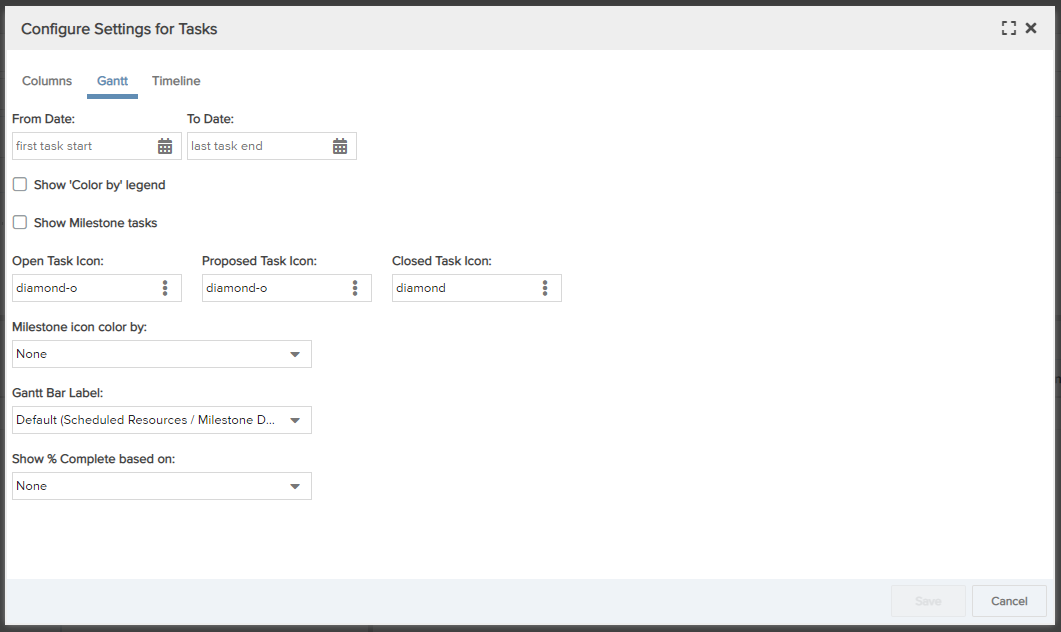
The Gantt Settings tab is where you configure different aspects of the Gantt chart; each setting is described in the table below.
| Setting | Description |
|---|---|
| Gantt Date Range | Select the date interval to display. |
| Show 'Color by' Legend | Check if you want a legend to appear below the project Gantt to show the value represented by each color. |
| Show Milestone tasks | Check to display Milestone tasks in the Gantt chart. |
| Open Task Icon | Select an icon to represent open milestone tasks in the chart. |
| Proposed Task Icon | Select an icon to represent proposed milestone tasks in the chart. |
| Closed Task Icon | Select an icon to represent closed milestone tasks in the chart. |
| Milestone icon color by | Select a field to establish the color coding of the milestone icons. |
| Gantt Bar Label | Select a field whose value will appear as a label to the right of each bar. Use any column configured on the Gantt Columns tab. |
| Show % Complete based on | Select any % field to display a darker shade on top of each Bar #1 to represent the % complete of that field's value. The darker shade gives each bar the appearance of a progress bar. This feature is specifically for treating the Gantt bar like a progress indicator, and can be based on any % field, in addition to Project % Complete. |
Task Gantt Chart Elements
The Gantt chart represents tasks according to the following:
- Red bars - tasks on critical path
- Blue bars - automatically scheduled tasks (not manually scheduled, not on critical path)
- Gray bars - manually scheduled tasks
- Thin gray bars (appear on thick gray/thick blue bars) - complete date
- Black diamond - milestone
- Downward-pointing shape at begin/end - summary tasks
- Blue arrow - In-project dependency. The task at the start of the arrow must be completed before starting the task at the end of the arrow.
 - Cross-project dependency. It appears to the left of a successor task and to the right of a predecessor task. You can hover over the icon to discover which project the task is dependent on.
These elements are called-out in the screenshot below:
