
Variable Settings Tab
The report designer's Variable Settings tab is where you:
- choose which entity-level Reports grids the report can run from
- apply filters to the report
- configure whether to allow report viewers to change the scope or change the filters - either before running the report, when viewing the report, or both
- configure grouping by date frequency
You can move to any of the other tabs by clicking General, Data, Display, or Team.
What is a Scope?
The report "scope" determines the context in which to run the report - across one entity/data set or across multiple entities/data sets. For example, the Project scope allows you to report on any aspects of the project you specify - that individual project, its tasks, issues, team members, and so on. The Organization scope allows you to report on any aspects of the Organization - assets, portfolios, accounts, projects, and so on. One way the scope is set implicitly is by where the report is run - see Put Report on Select Entity Report Grids (below). In addition you can configure the report to allow changing scope manually - see Allow Changing Scope.
Put Report on Selected Entity Report Grids (implicit scope)
You can configure reports to be run from the Reports list of any of the following entities: project, portfolio, resource, division, department, organization. Those report lists are generically referred to as "entity-level Report lists" and must be selected manually. You can also run reports from the main Reports list that you access from the top-level Report navigation icon ("top-level Report list") - no provisioning required, reports are automatically shown on that grid. It is important to understand the implications of running from one grid or another:
Where a report is run provides the implicit context, or "scope" of the data on which it will run. For example:
- a report run from the project Reports list is automatically scoped to the current project.
- a report run from a portfolio Reports list is automatically scoped to the current portfolio
- a report run from the top-level Reports list is automatically scoped across the entire data set. Note that the top-level Reports list and the Organization entity-level Reports list share the same scope (entire data set).
Note: Remember that you are reusing the same report definition on each grid you select - no need to worry about report count bloat. Our existing customers who are familiar with legacy report are accustomed to writing a report for each report "Target", which is essentially each grid; you no longer need to do that. Now back to your originally scheduled programming :)
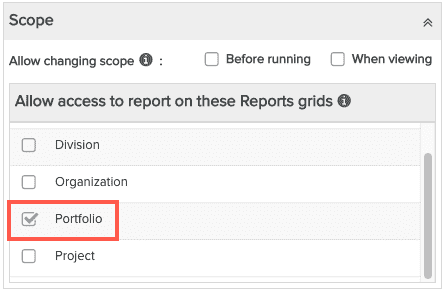
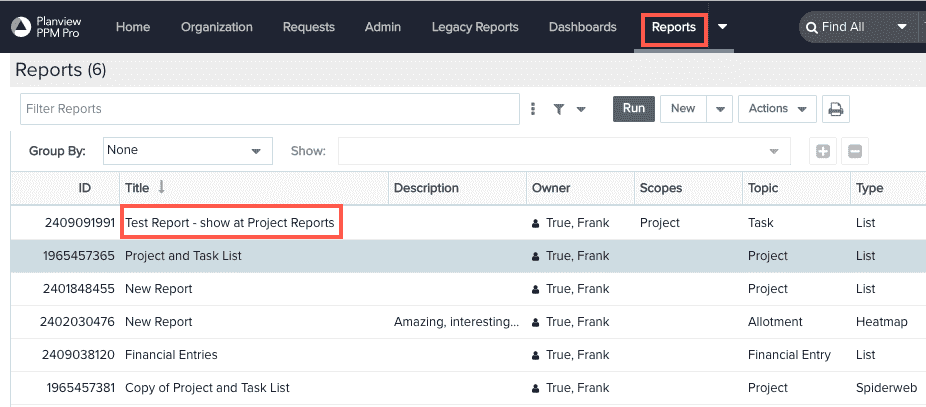
To place a report at any entity-level grid, simply check the box next to each entity you want access to the report - see screenshot 1 below. There is no checkbox for the top-level Reports list, since all reports can be accessed and run from the top-level Reports list by default. Remember that in addition to checking the boxes, the report consumer must actually run the report from the specified entity grid(s) - simply checking the box does not scope the results to that context/data set.
|
1. On the Variable Settings tab, select the entity report grid:
|
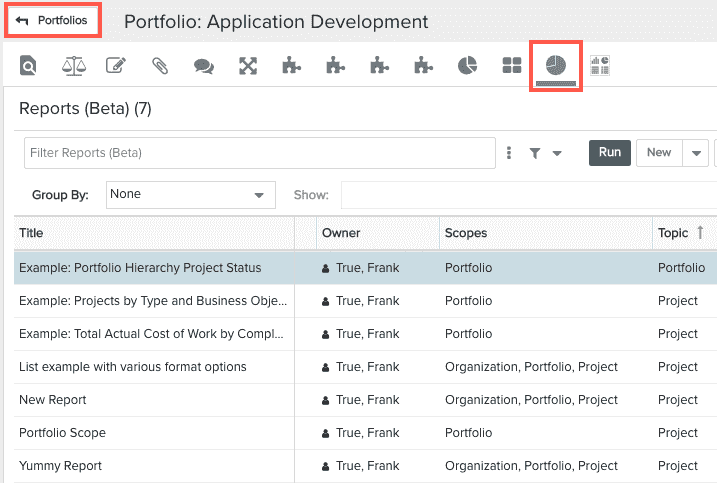
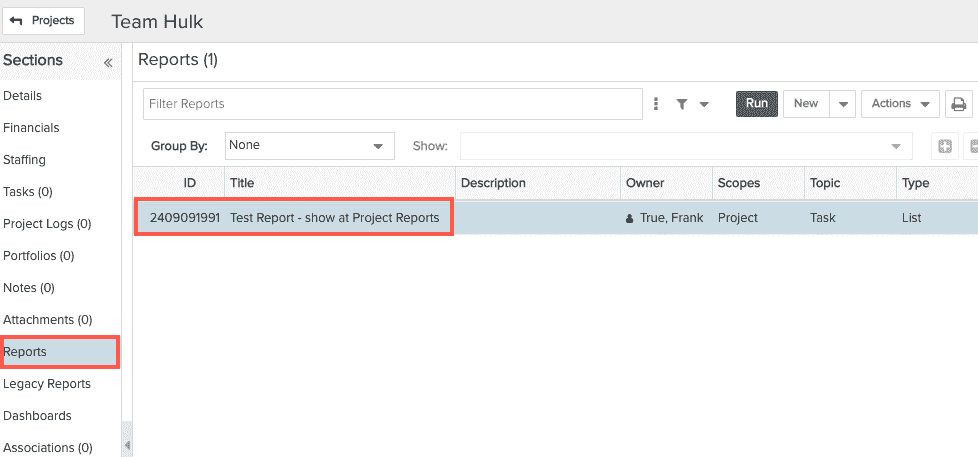
2. Report appears on Reports list of Portfolio: Application Development (and all other portfolios). Run the report from this grid to scope the data to this portfolio. |
|
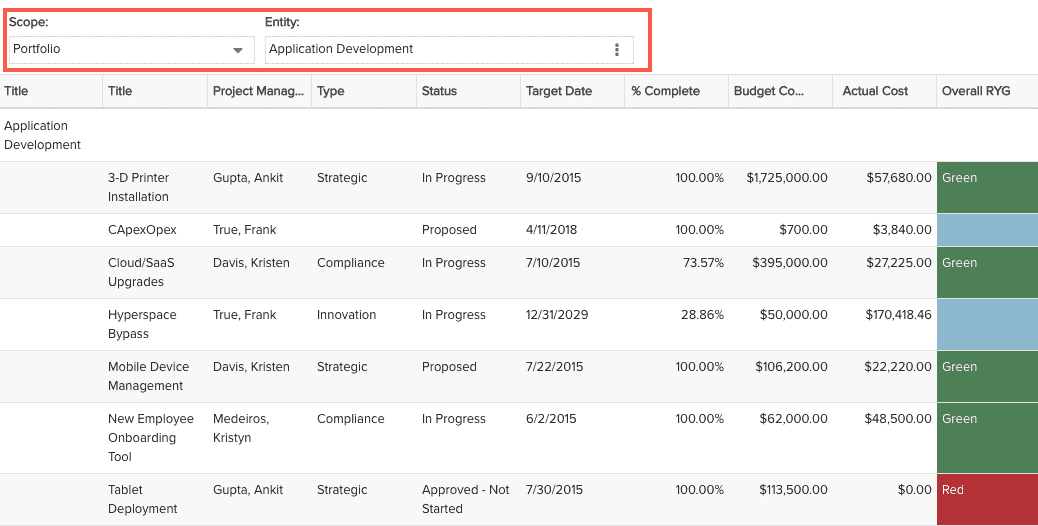
3. The report results will be scoped to that specific portfolio; users can have the option to select a different entity instance or different entity altogether, provided the report is configured to allow changing scope. In the screenshot below, the report is scoped to the Application Development portfolio - the user can select a different portfolio, or even a different entity (scope).
|
|
Which Grids are Available?
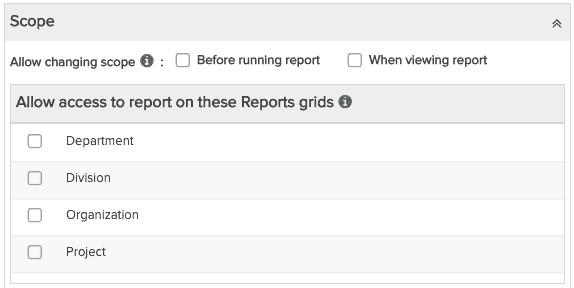
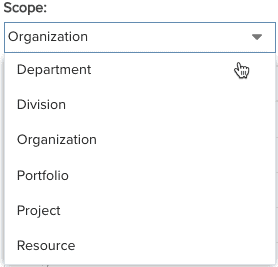
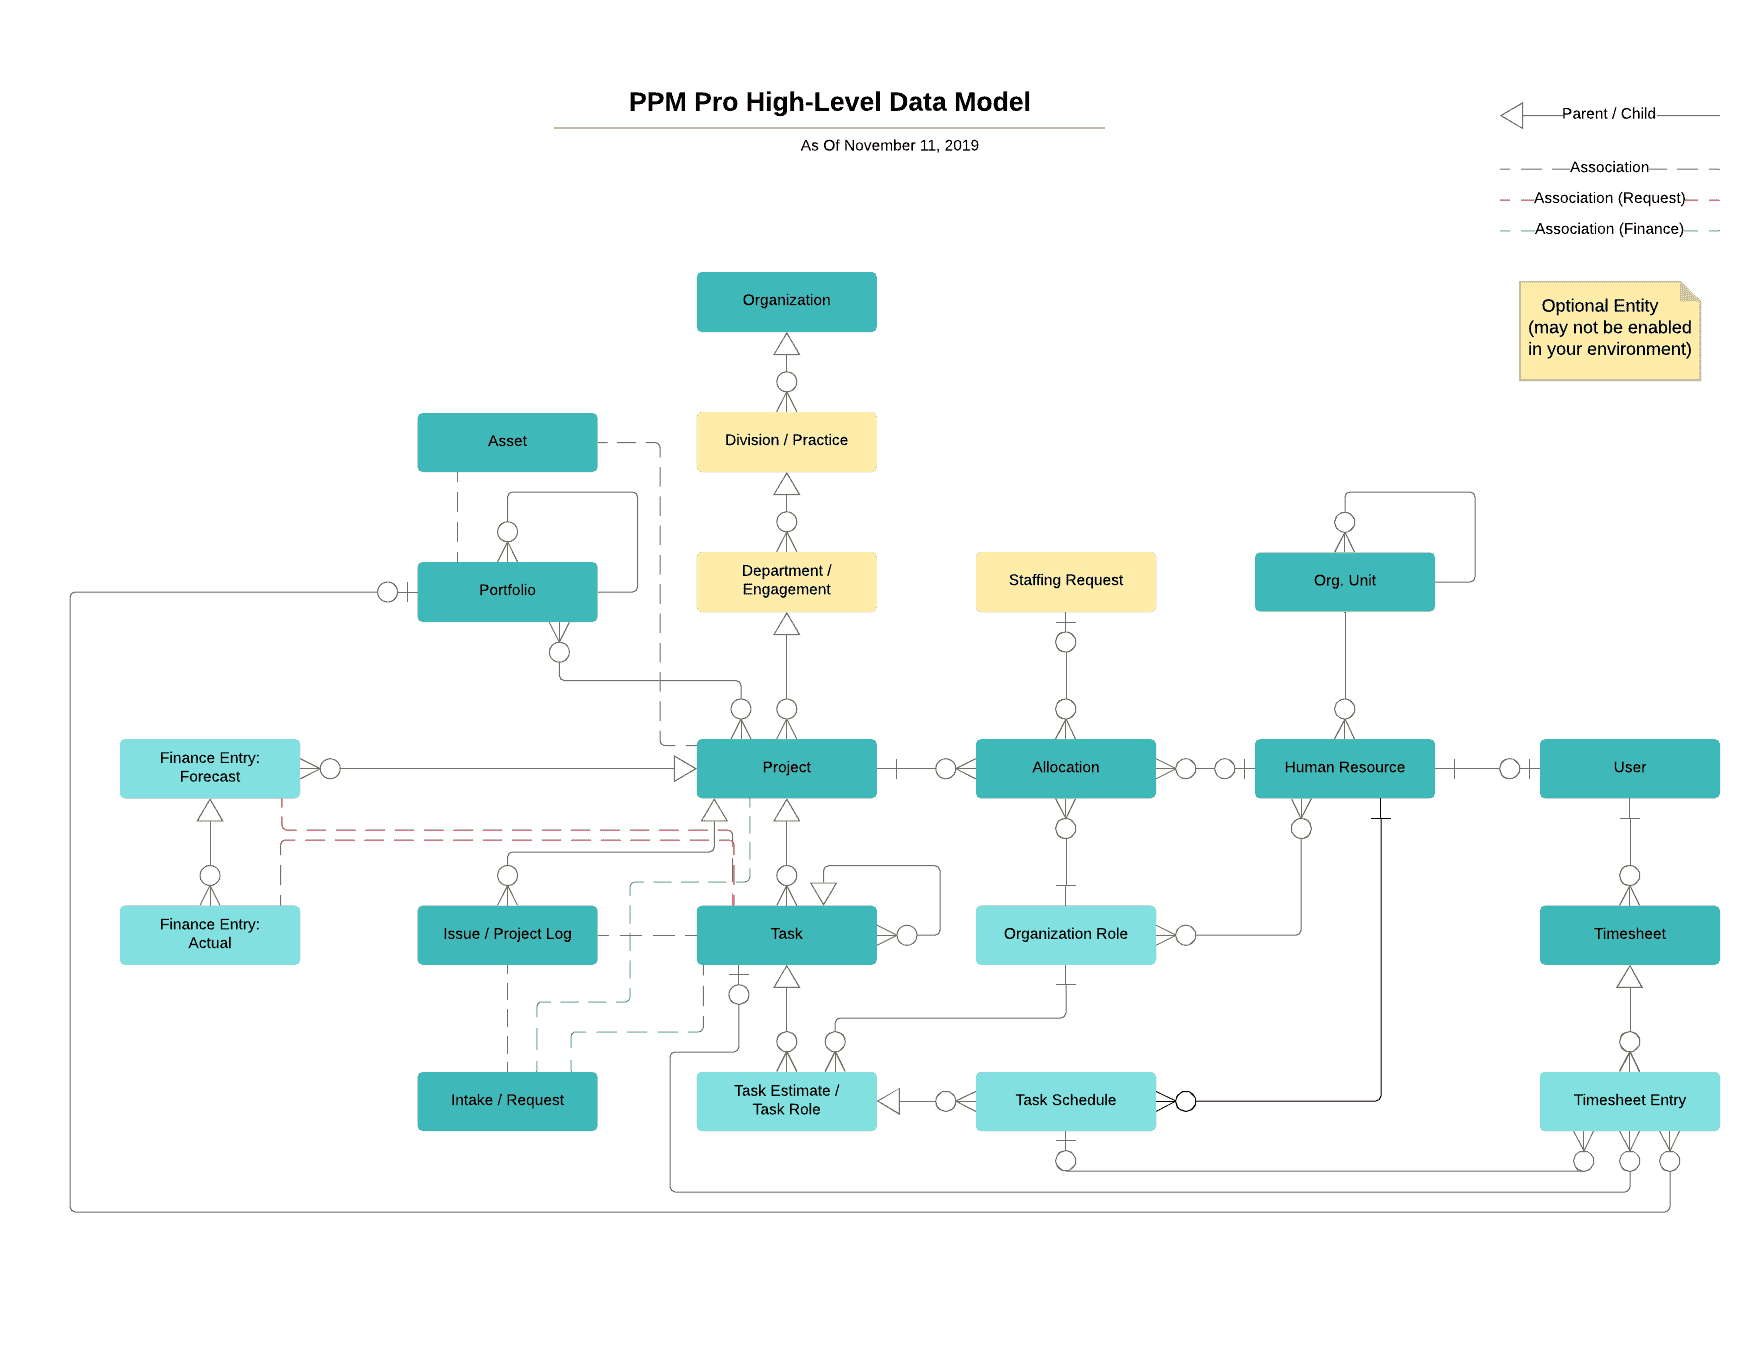
The list of available grids is determined by the report Topic you selected on the General tab; the list of grids will always be "containers" (higher in the hierarchy) for the Topic, as well as the Topic entity itself. For example, if your Topic is Project, then your available grids will be Project, Division, Department, Organization. In the screenshot below, the Topic is Project, and the possible scopes are Project itself and all entities that contain projects (Organization, Division, Department), as shown below:
How Do I Know Which Grid(s) to Put a Report On?
How does a user know which scope to select, at runtime or upon viewing the report output? Think about what the data set needs to include. The broadest scope (returns the most data) is "organization", meaning report data is pulled from the entire organization. A scope of "project", for example, would narrow the data set to a single project. A Department scope would return data related to one department (which is significantly smaller than the Organization, but can include multiple projects).
For example, using the screenshot below, if you select the Projects grid, then the report will be available on the Reports list of each project. When you run the report from a project, the report will be automatically scoped to the current project. You can select multiple grids to make the same report accessible for multiple entities - all from within the same report definition. The report will reflect different levels of data based on where it is run. Each data set will include all entities below it in the hierarchy - for example, the Portfolio data set includes projects).
Check the box next to each entity(ies) whose scope makes sense for the report. For example, if you check Division and Project, then you can run the same report across specific projects; then, if you want to run across all projects, you can run at the Division level. Reports are always available at the top-level Reports list.
If you do not select any grids, the report will appear only at the top-level Reports list, where the report will be run across the organization-wide data set.
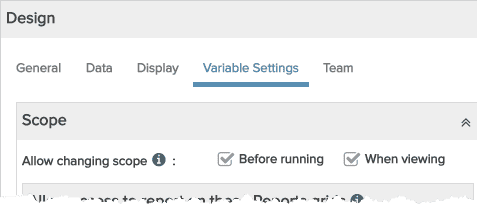
Allow Changing Scope
Running a report from an entity-level Reports list is one way to automatically scope a report. Additionally, you can grant users the ability to change the scope (context in which the report is run) when running and/or viewing the report. You grant this ability by enabling the setting "Allow changing scope" that appears near the top of the Variable Settings tab. When you enable this setting for a report, the user running the report will see a Scope droplist on the rendered report - the user can simply choose a scope and the report will be re-run on the selected data set. The setting and the Scope menu are shown below.
|
1. Enable "Allow changing scope" setting to make the Scope menu available, then Save & Run the report.
|
2. Choose a different scope. If you choose any entity other than Organization, an Entity menu also appears (shown in step 3). The exact scopes that appear in the menu depend on the report Topic. For example, if the report Topic is Project, then the Resource menu item would not be shown - if you ran a project report from the Resource Reports grid, no data would be returned.
|
3. Selecting an entity automatically re-runs the report, scoped to the selected entity instance.
|

Filters
You can use filters to further refine the data to report on by using the meta-data associated with the report Topic entity and field paths to narrow the results set. For each entity (project, task, project log) that you select in the report definition's "field path" on the Data tab, an ad-hoc filter will be added to the Variable Settings tab, where you can optionally enter filters. If you need to further segment your data in a more granular fashion across all aggregatable (numeric) fields, you'll want to use Field-Level Filters.
Below is an example of a Topic and field path - you can filter on project and Allocated Roles
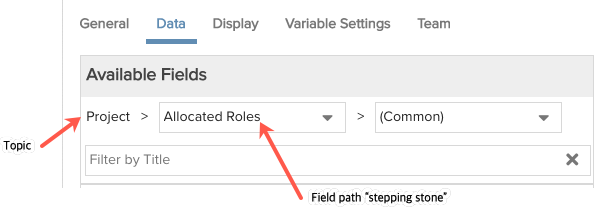
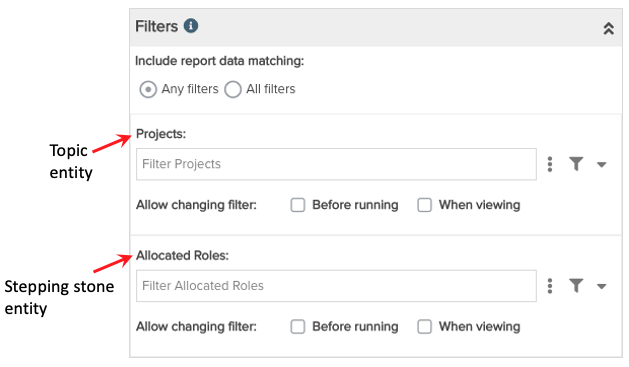
For example, if your report topic is "project", you can use a filter to specify which projects to report on. And if you only wanted to report on active projects, you could specify a filter for identifying active projects. The filters that are available will be based on your report topic and any related attributes/fields that also can be filtered. If you select another entity as a stepping stone in your field path, such as Allocated Roles shown in the above screenshot, then you'll be able to filter on that entity as well (shown below):
You optionally can allow end users to apply filters either before running the report in the Runtime Options, or when viewing the rendered report. If you do not allow end users to change filters, the report will always run with the filters used in the report definition, if any.
If you add multiple filters to a report, you can also choose how those filters work together to return results. You can choose to include results that match any filter criteria or results that match all the filter criteria. The screenshot below shows that option at the top of the Filters pane.
Note: When merging child rows with a parent, the All option will not be taken into account.

Allowing Changing Filters
Similar to choosing scopes at runtime or when viewing the rendered report, you can change filters the same way. At the bottom of each entity filter control are two checkboxes: Allow changing filter: 'When running' and 'When viewing'. You can choose either or both options.
If you select 'When running', when the user runs a report they will be presented with a Runtime Options modal showing that filter as an option and with any filters previously set by default. For example, if the report has a filter configured for 'Agile Projects' and the option to allow changing that filter when running the report is selected, then the Runtime Options modal will appear with the filter control editable and defaulted with 'Active Projects'. The user can then change the filter before running the report.
Similarly, if you allow changing a filter when viewing a report, then after the report is run, the filter control will appear at the very top of the report with whatever filter had been originally configured or set at runtime defaulted. The user can again edit the filter while viewing the report output.
Grouping by Date Frequency (Time Series)
For reports that include dates, the Time Series section contains a Frequency drop list that lets you choose a frequency to group by. Additionally, a date range is available for the following reports:
- List type reports that group on a Date field
- Crosstab type reports for Timesheet/Timesheet Entry (topics) that include a date as a Top Axis value
Using a frequency with a date range allows you to build a time series report broken out by the chosen frequency.
The Time Series section is shown below:
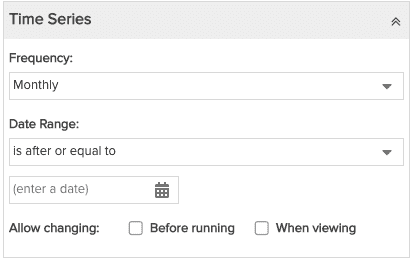 |
Frequency - choose how often to aggregate data:
For example, if the current date is 6/12/2020, then the first daily interval would be 6/12/2020, the first monthly grouping would be 6/1/2020, and the first quarterly interval would be 4/1/2020. |
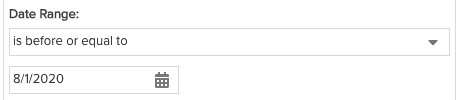
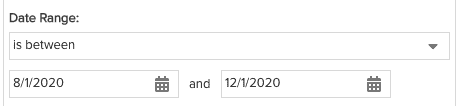
The Date Range is determined by selecting an operand - such as 'is after or equal to' or 'is between' - and then entering one or two dates, depending on the operand. If the operand is relative to one date - such as "is after or equal to" - then you will enter one date; if relative to two dates, such as 'is between' - then you will enter two dates. For example:
 |
 |
If no operand is selected, then no date field is shown.
Learn More...
Visit How To Build... for information about building various reports.