
Visualizing the Impacts of Change in PPM Pro
At times, especially recent times, you and your organization needs to be able to visualize portfolio impacts in order to quickly react to changes happening to your business. You and your PMO may find yourselves asking questions such as:
- Is there a way to validate and test out changes before making them?
- How can we document and ensure changes that require follow-up do not get lost?
- What other capabilities are available to help us monitor the impacts of our changes?
- How can we ensure our stakeholders have the right information so they can effectively make decisions?
The goal of this video/article is to provide you with answers and ideas within PPM Pro for how to visualize impacts due to changes happening during times of disruption.
Sandboxes
If you are embarking on making changes to your work, people, financials, or other key items in PPM Pro, one place you can first try out those changes is on a PPM Pro Sandbox instance. Sandboxes are copies of your production environment, including the same data and capabilities. You can refresh a Sandbox any time except within the third week of each month when Sandboxes have a different release code than production environments. You can use your Sandbox to test, validate, and visualize any changes you want to make before you make them in your actual Production environment.
Contact your Account Executive if you don't have a sandbox and would like to learn more about obtaining one.
Notes, Status Comments, and Attachments
Once you decide to make a change to a portfolio, project, or other entity in PPM Pro, you can capture details about the change within Notes, Status Comments, or a general text field. Likewise, you can use attachments to help document changes. If you don’t have one or more of these on your entities, your Admin can usually add them as fields or sections to the entity category.
See:
Baselines
Another useful feature is baselines. Creating baselines will enable you to capture snapshots of your key project plan values, such as, status, start and target dates, duration, costs, and revenues. You can view baseline data at any time, and can report on baseline-to-baseline data and baseline-to-current plan data in order to monitor the progress of the project or identify changes in project scope. You can also compare current Staffing with a baseline's Staffing.
See About Baselines.
Project Logs/Issues
If you’d like to not only document but also take action on needed project changes, consider using Project Logs. Your Admin can create one or more Project Log categories to track risks, problems, change orders, and other key information. Even better, you can assign one or more people to be responsible for resolving these project logs. And of course, you can report on them so that your stakeholders can see these changes, impediments and resolutions to your project work.
KPI Trend Fields
After you’ve made changes to your portfolios and project work, you also should monitor key performance indicators (KPIs). Your Admin can set up trend fields to capture weekly and monthly snapshots of any portfolio or project KPI field. These snapshots enable you and your stakeholders to monitor, analyze, report on, and identify additional changes needed across your portfolios and projects.
See:
Capacity and Demand
You can also visualize and monitor the impacts of changes to your people’s availability and project allocations. Use Capacity and Demand analysis to generate basic reports showing demand from projects and tasks, as well as resource capacity. You can view this information based on role, resource, or one or more projects.
Time Tracking
If you are not currently using time tracking within PPM Pro, consider if it is worth setting up at least during times of unplanned change or disruption - you do not have to use time tracking all year long – leverage as needed. Time tracking improves the ability to accurately forecast project timelines and deliverables, helping to predict and measure task and project progress. It enables you to realize billing and charge backs, understand resource rates and perform quick reconciliations, and generally manage expenses. Visibility into what your resources are working on, whether task, portfolio, or administrative, helps you ensure appropriate balance and that your people are focused on the critical work needed.
Reports and Dashboards
Finally, the ultimate way to visualize and make sure your stakeholders are aware of changes, is through the use of reports and published dashboards. Depending on what entity information is most critical to see, various reports can be created and added to dashboards for publication to your stakeholders. Please see the Savvy PMO's Guide to Visibility and Reporting for growing impact with six key areas of visibility and dashboards. The two example dashboards covered in the video above and that may be of particular value during times of change are an executive Overview dashboard and a Portfolio Financials dashboard.
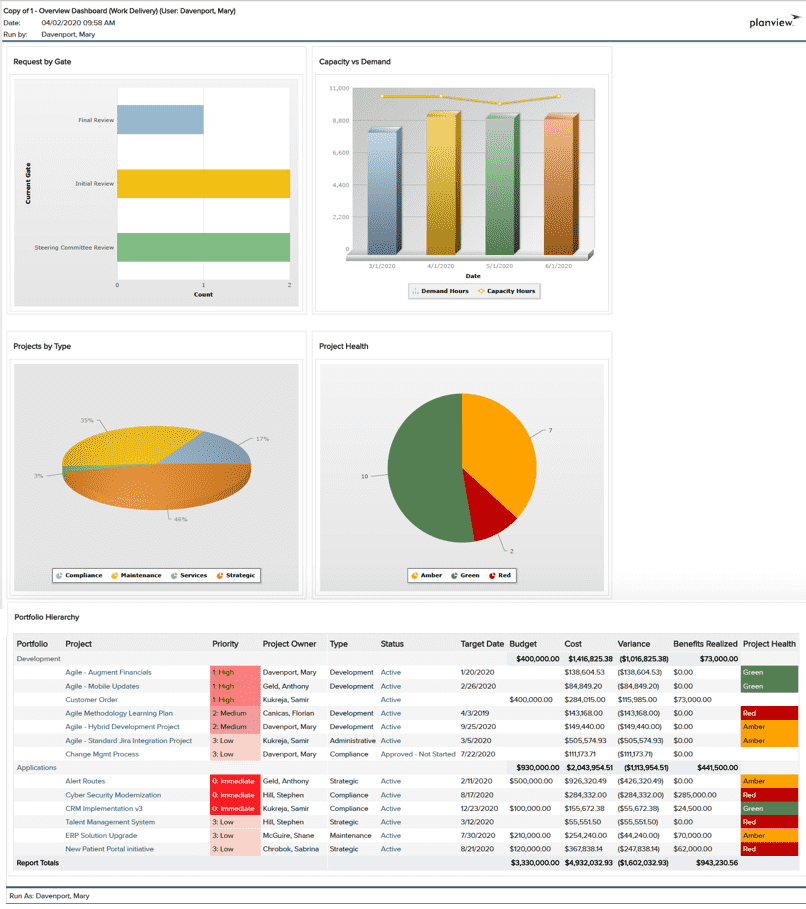
Overview Dashboard
This dashboard provides views into the work, people, and financials based on all the changes you recently have had to make. Your stakeholders can see all of the new work coming into the organization. There is also a report showing capacity versus demand of your people resources, to help understand if you can even take on any of this new work. Your stakeholders have a view into the types of work being done, so that they can see where time is being spent and if it aligns with where the organization currently needs to be spending their effort. They can see how healthy projects are and where there are challenges delaying delivery. With all dashboards, you can drill down to get to tactical level information such as the latest project status comments, issues, risks, and other information to provide insights in what is needed to get a project back on track, elevating the conversation to promote meeting deadlines and priorities that have been set by the organization.
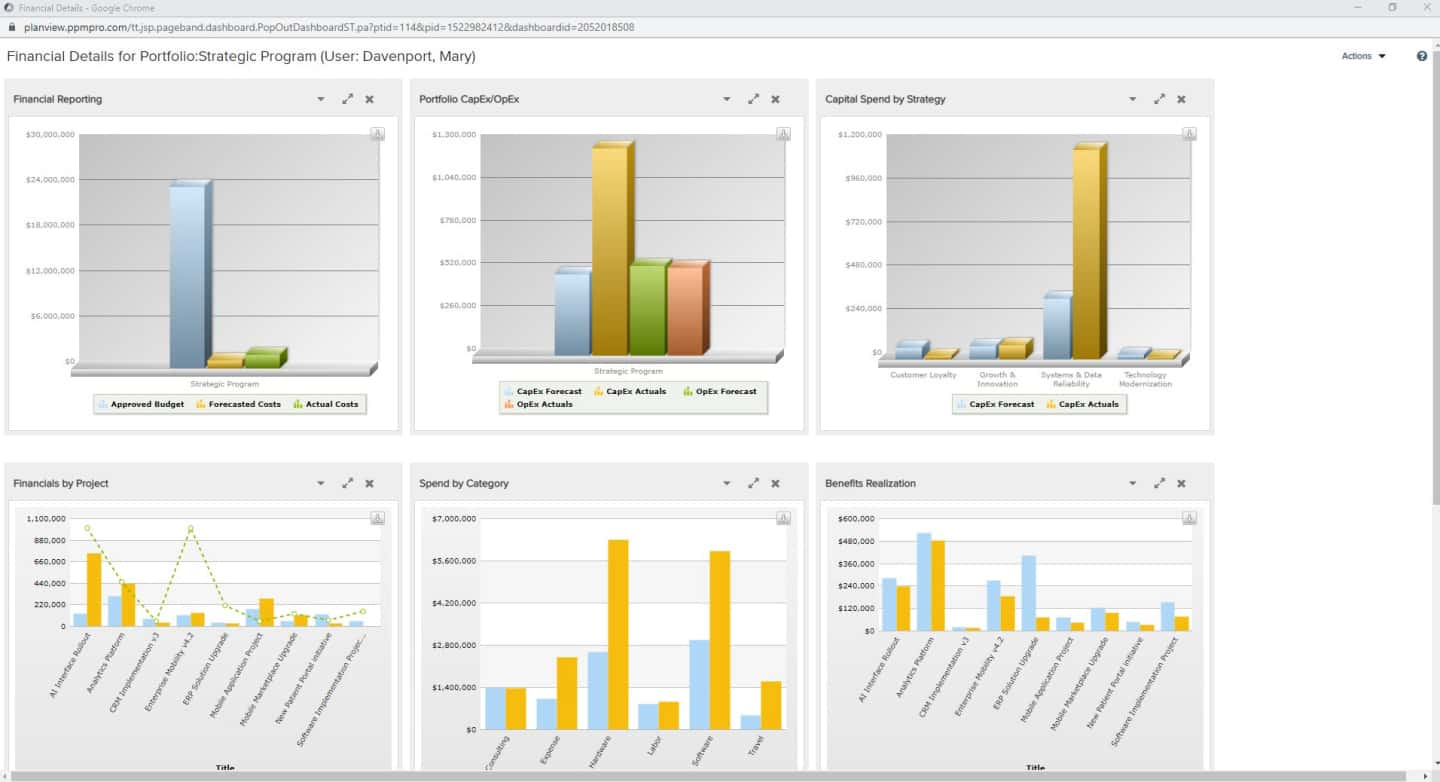
Portfolio Financials Dashboard
A dashboard focused on portfolio financials will allow you to quickly understand how the organization is doing in terms of what has been approved versus forecast versus actualized. You can visualize the financials in various slices, such as capitalized versus operational costs. You can see how your portfolio's project financials are performing and drill-down into a project for deeper analysis and management. You can also include trend field reports, to monitor snapshots of your financials across different projects.
Summary
We hope these ideas have provided useful ways to help you visualize changes to your people, work, and key information to make the best decisions, when it matters most. With as much or as little support as you want from PPM Pro and Planview, your PMO can shift and pivot as your business responds to the unexpected effects of unplanned disruption. If you have any questions that we haven’t answered, please let us know by reaching out to PPM Pro Customer Care, your Account Executive, Success Manager, or Product Management.
Please feel free to take a look at the other videos in this series: