
Using the What If workbench
After you configure your What If filters, you use the What If Workbench to manipulate the data you loaded into it. This topic covers how to:
-
manipulate data to create different scenarios
-
generate a list of changes for reference during implementation
Anatomy of the Workbench
3 main areas: Workload grid, Resources/Roles grid, and Charts
Workload
The top grid displays the workload for the project filters selected. Under a project row, rows for role demand are displayed and under roles, rows for resource allocations are displayed.
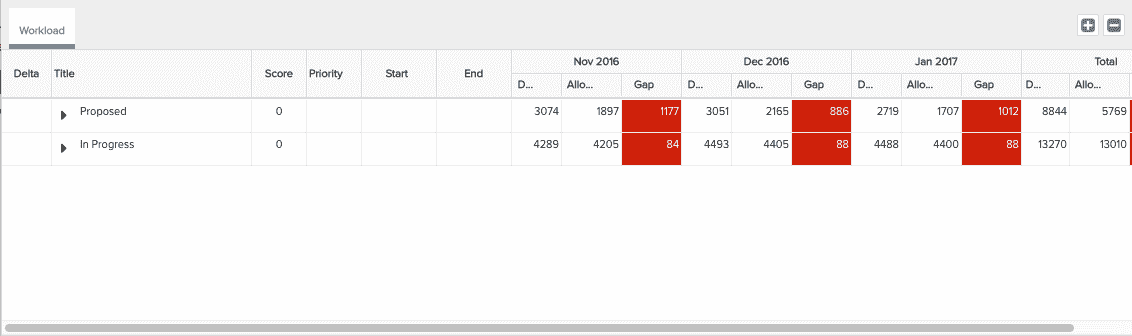
The Workload grid is where you shift and include/exclude projects. You can also book resources.
You can expand or collapse all the folders in the grid by clicking the Expand ![]() or Collapse
or Collapse ![]() icons at the top-right of the grid.
icons at the top-right of the grid.
Resources/Roles Grids
The bottom grid displays the Resources and Roles tabs.
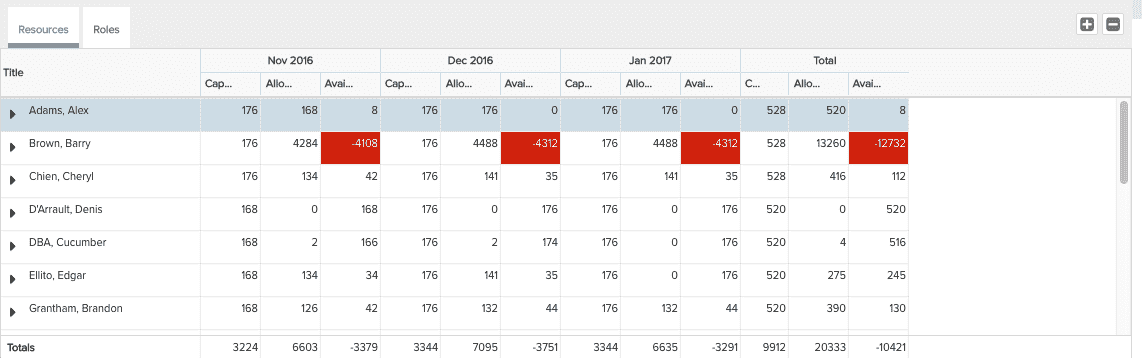
The Resources grid displays all the resources allocated or scheduled to the projects in the Projects grid. Each resource is displayed with its corresponding project, and the role filled for that project.
The Roles grid displays all the roles demanded for the projects in the Projects grid. Each role is displayed with all the resources assigned to that role, and any projects to which the resource has been allocated in that role.
You can expand or collapse all the folders in the grid by clicking the Expand ![]() or Collapse
or Collapse ![]() icons at the top-right of the grid.
icons at the top-right of the grid.
Charts
The charts can be expanded and collapsed. You can drag the slider to the right to basically hide the charts panel and maximize your grid space. You can view or hide the charts by clicking the charts icon (shown to the left of the collapsed chart at the top-right of the workbench screen.
Column Definitions
|
Column |
Definition |
|---|---|
|
Delta |
This column displays the shift or exclude offset. For example, if you shift a project out by 2 months, you will see +2mths in this column. If you exclude an item, you will see a |
|
Title |
The name of the project, role, or resource. |
|
Score |
The project score (only available if the project was scored). |
|
Priority |
The priority assigned to the project. |
|
Start |
The project start date. |
|
End |
The project end date. |
|
Workload Repeating Columns Under <date> and Total |
|
|
Demand |
Demand for a project summed up across all roles. |
|
Allocated |
Resource allocation booked for the project. The value is displayed on the project row and rolled up to the resource. |
|
Gap |
Demand minus Booked. If the gap is negative (overbooked), 0 is displayed. |
|
Total |
The Grand total for each of the columns listed above. |
|
Resources/Roles Repeating Columns Under <date> and Total |
|
|
Capacity |
Capacity for a resource's primary organization role, excluding calendar events |
|
Demand |
(Roles grid only) Demand for a particular role |
|
Allocated |
Resource allocation booked for the project. The value is displayed on the project row and rolled up to the resource. |
|
Available |
Capacity minus Booked. Negative numbers represent over-booking. |
|
Total |
The Grand total for each of the columns listed above. |
The Actions menu
The Actions menu contains a set of actions you can perform on a scenario.
|
Actions menu |
Action |
Description |
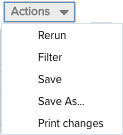 |
Rerun | |
|
|
Filters |
Brings up the Filters dialog so you can make changes to the data and run the scenario. |
|
Save |
Saves the current scenario, including any changes. You will be prompted to name the scenario and can also set its visibility. |
|
|
Save As |
Saves a copy of the current scenario. You will be prompted to name the scenario and can also set its visibility. |
|
|
Print Changes |
Generates a list of all the changes to made to the scenario. You can print this list and refer to it if you choose to implement the changes. |
Customizing the Workbench
To expand or collapse all folders in the workbench, click the ![]() or
or ![]() at the top of each section.
at the top of each section.
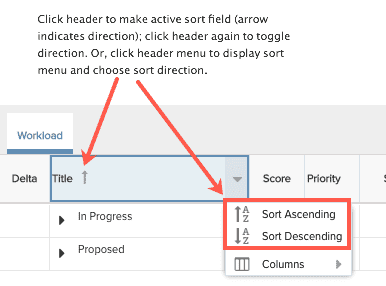
You can customize the Workbench grid layout using the column header menu. Hover the cursor over any column header to display the down arrow; click the arrow to display the menu.
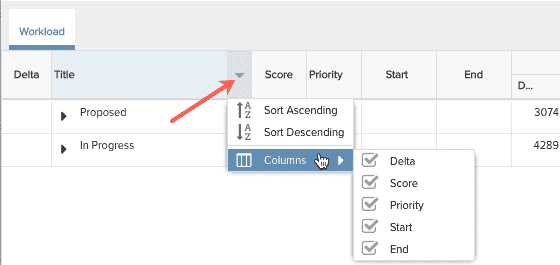
Sorting
To sort a list, simply click on a header. An arrow pointing up indicates ascending sorting; down indicates descending. Alternatively, hover your cursor over the header to display the sort menu. Choose the sort order.
Move Columns
You can move columns to any position by simply dragging the column header.