Comparing Scenarios
You can select two scenarios and compare them. Results are presented in five output types: Scorecard, Project List, Timeline, Heatmap, and Info. A typical use case for comparing scenarios is to apply one or more of the original scenario's Optimization Suggestions to a second scenario and then compare it with the original scenario.
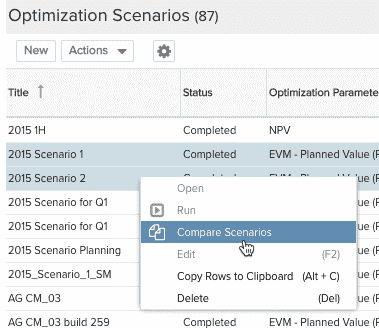
To initiate a comparison, simply select the scenarios and choose Actions > Compare Scenarios, or right-click on one of the selected scenarios and choose Compare Scenarios:
Scorecard Comparison
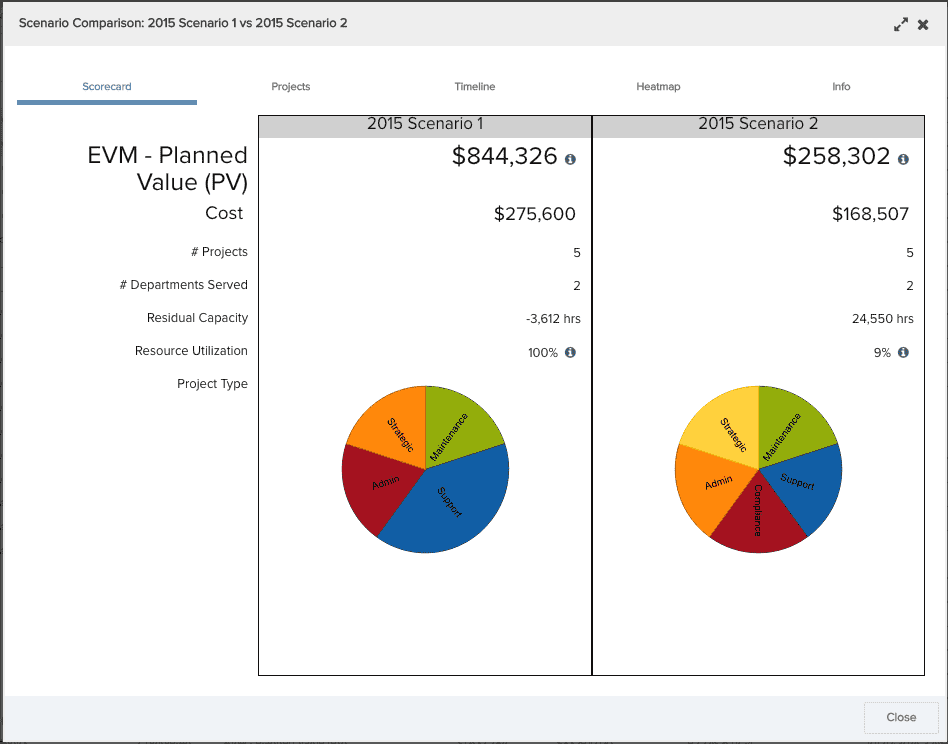
The Scorecard tab provides a high-level overview of the output. For each scenario, the Optimization field(s) is displayed at the top, and the pie charts represent the project types that are included.
Residual capacity is the remaining capacity after resources have been assigned. This value is derived from the resource filter you used and the projects that were included.
Resource utilization is the percentage of resources allocated (allocation/capacity).
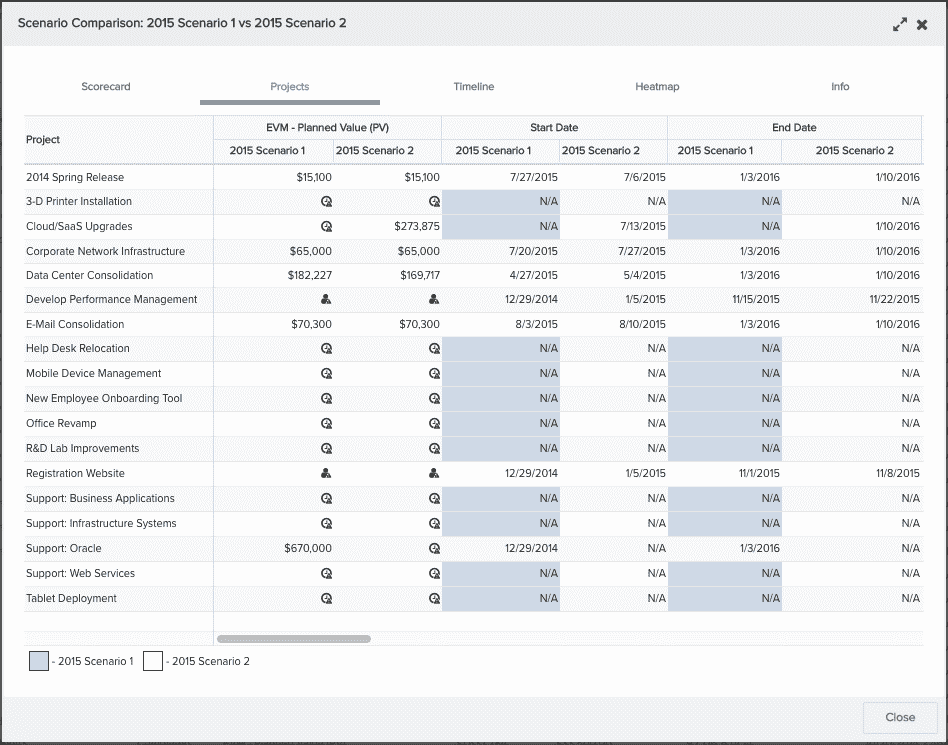
Projects Comparison
Comparison results present the values for each field, side by side for each project, as shown in the screenshot below. The fields that are being compared were specified in the optimization settings (by an Admin user).
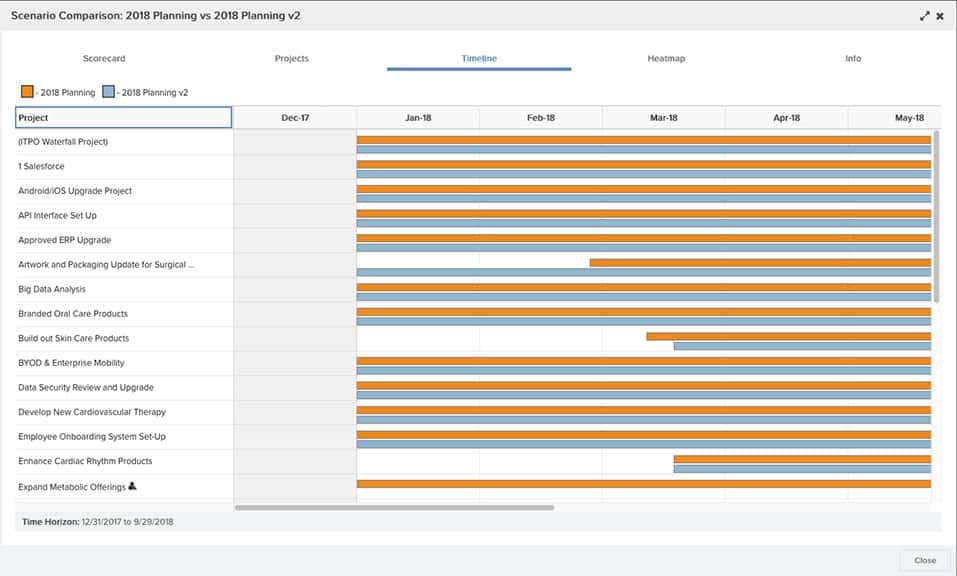
Timeline Comparison
Directly compare project timelines.
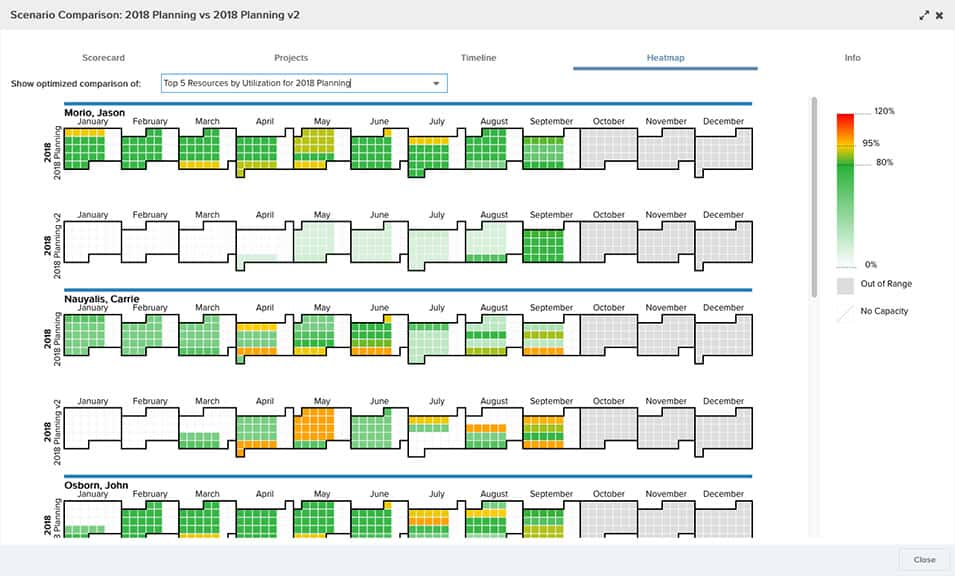
Heatmap Comparison
Directly compare resource utilization.
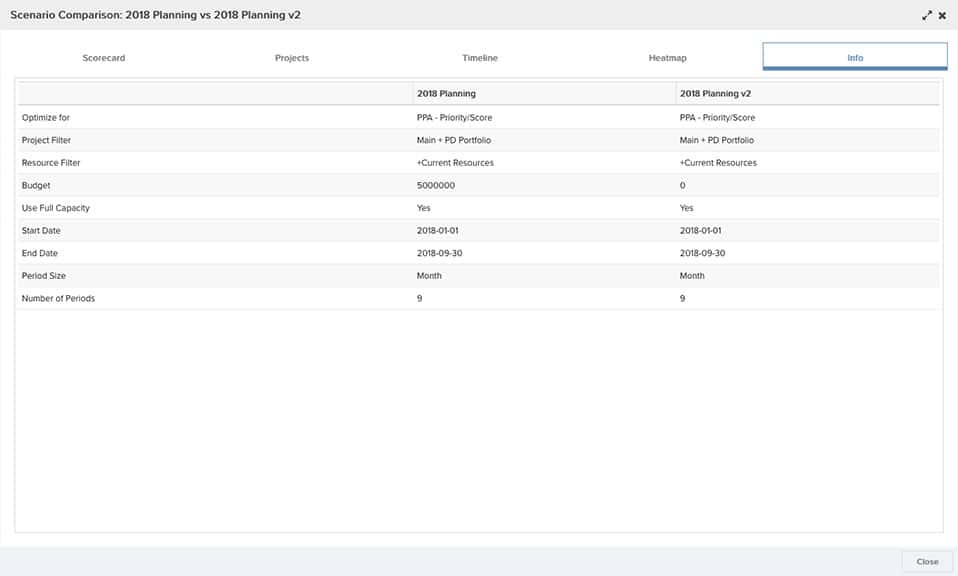
Info Comparison
Basic information about the scenarios.