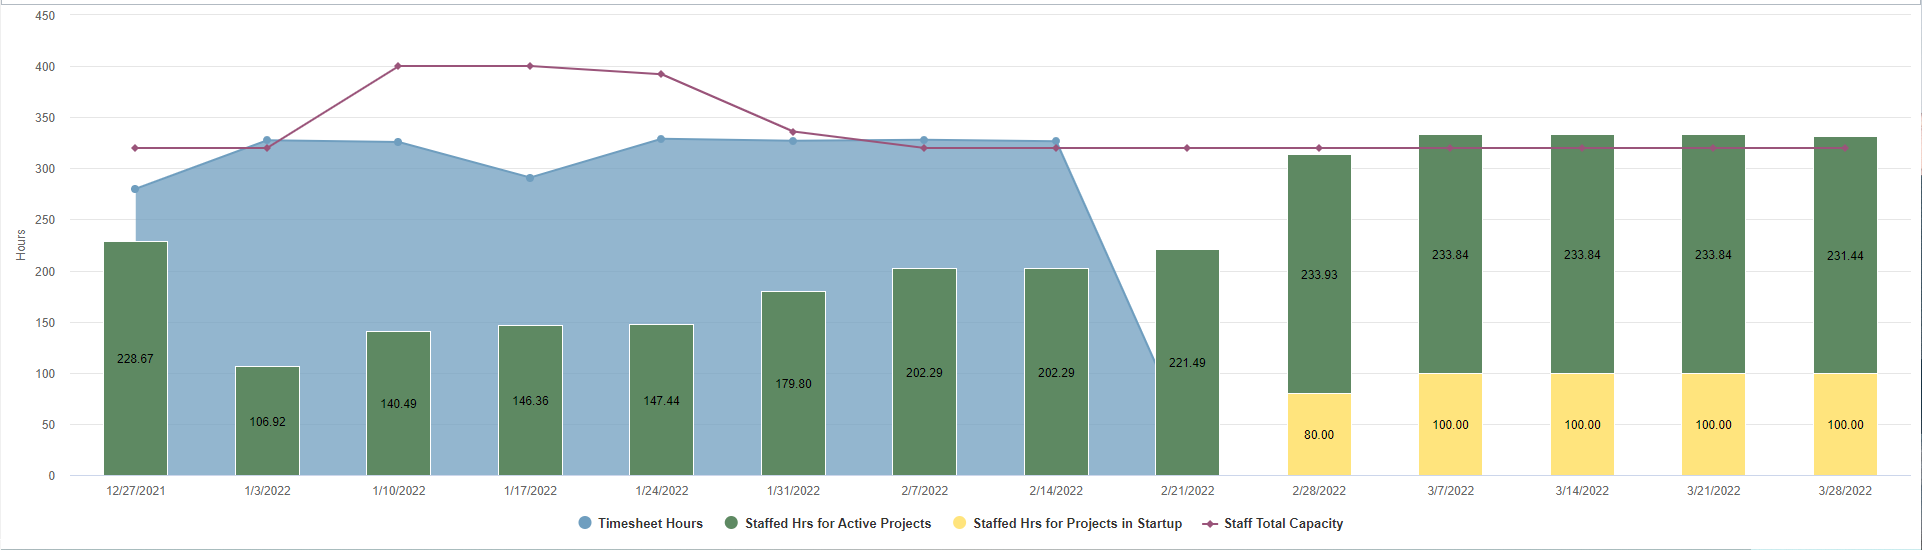
Capacity vs. Project Allocations vs. Timesheet Hours
Compares staffed project hours, optionally broken out by proposed and active projects, versus timesheet hours and capacity hours. You can build this report using the design settings in the table below. Alternatively, you can download this report definition and upload it to your PPM Pro instance.
| Design View | Selection | Comments |
|---|---|---|
| General |
Topic: Resource Specialty: Time Series Type: Combination: Stacked Area, Stacked Column, Line Title: <enter a meaningful title>
|
Other report Types that work well include Area: Basic; Bar: Basic; Column: Basic; Combination: Area, Column, Lina; and Line. |
| Data |
Bottom Axis: Date (Time Series) Left Axis - Column: Note that all time series fields must be selected from the main topic field path. For example, from the Resource available fields add the following:
Left Axis - Line: Capacity Hours (Time Series) Left Axis - Area: Actual Hours (Time Series) |
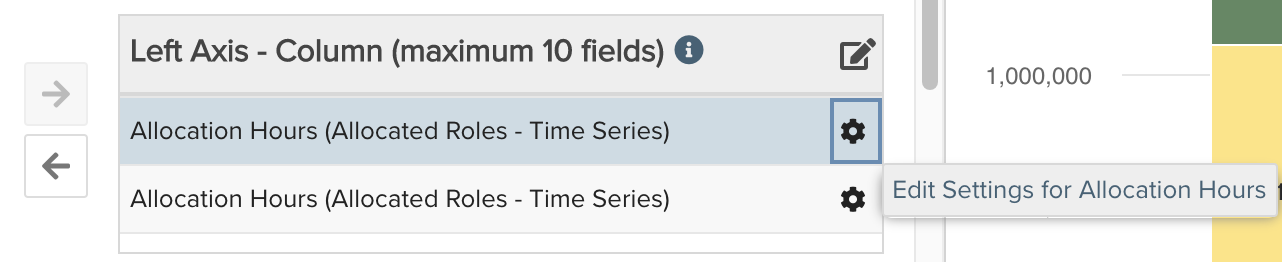
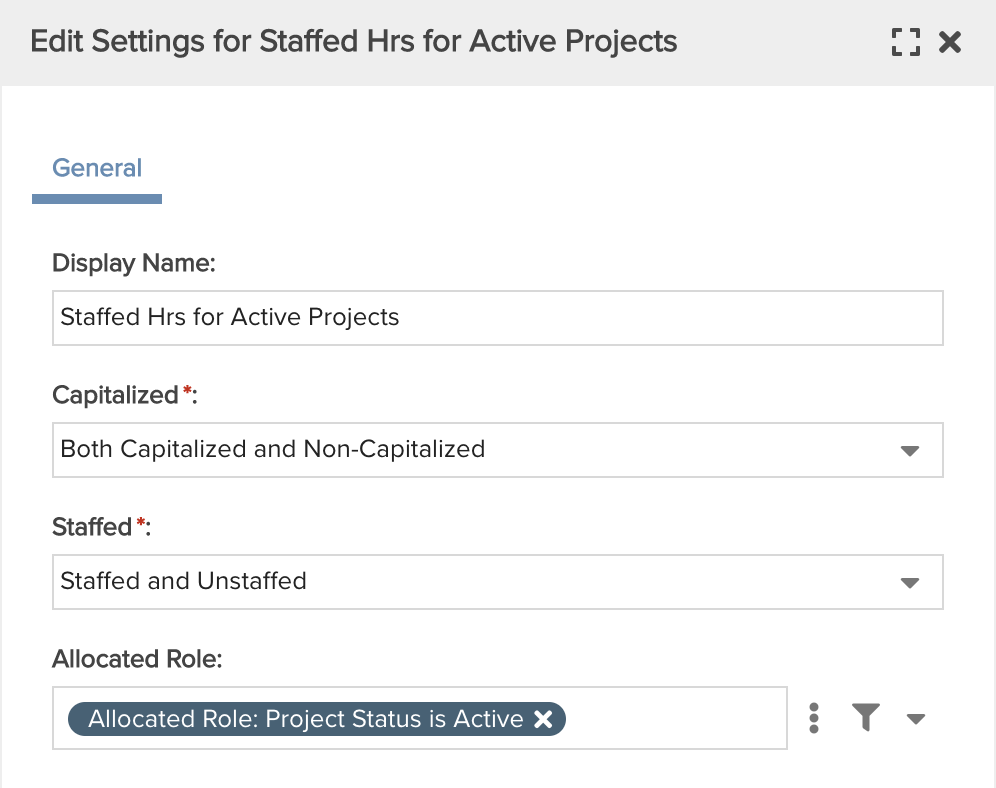
Breaking up the Allocation Hours by project status is optional; if you do not want to break this up, only add the field once to the Left Axis - Column and just edit the field settings to Staffed. To Edit Settings for a field, click the gear icon next to the field:
|
| Display |
Set desired Display options, such as: Data - Data values: Show |
|
| Variable Settings |
Set desired Time Series options, such as: Frequency: Weekly Date Range: Is between <date 1> and <date 2> |
Provide relevant filters, for example if you only want to see roles for certain types or for a specific unit. If you want to allow the user to change to a different Filter before running the report or when viewing the report, select the relevant checkboxes for Allow changing. |