
About Capacity and Demand
This video demonstrates how to track capacity and demand. These screens allow you to view your resource pools’ availability, and the projects they’re working on over a given duration. Duration: 4.5 min.
The Capacity & Demand facility is available to members of the following standard groups: Organization, Resource. If you are in the Capacity and Demand group, then to access this facility you will also need Resource > View > Availability permission (with either a Unit Manager, Special Access, or Global rule to view availability on all resource). See About Profile-Based Permissions and Creating Permission Profiles.
Also, see Resource Planning Terms and Influences.
This facility allows you to generate reports that show demand from projects and tasks, as well as resource capacity. You can view this information based on role, resource, or one or more projects. This facility can give you visibility into which projects and tasks need staffing attention, as well as forward-looking information about project and task demands on the organization.
The Resources/Capacity & Demand tab provides the following links to Capacity & Demand screens: Resource, Organization Role, and Project.
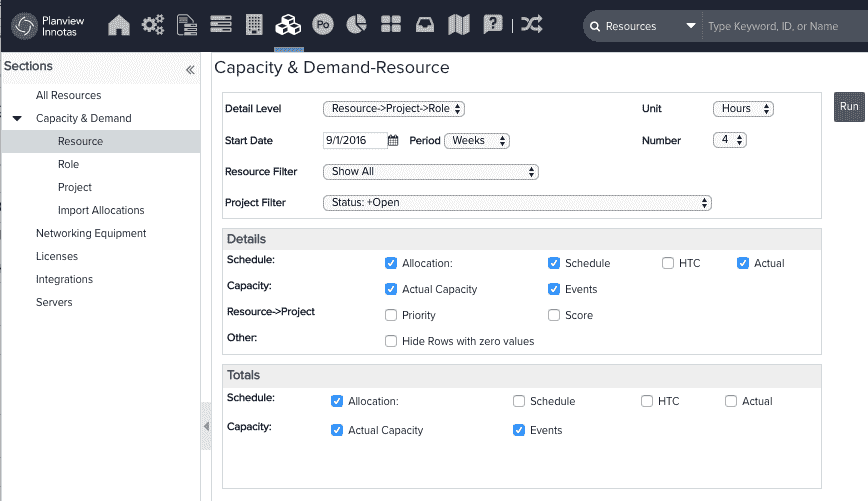
How to use the Capacity and Demand screens
Each screen has a top section that contains a set of controls that allow you to specify how to represent the data and for what time frequency. This section also contains a set of filters you can apply to your data, if any. The first time you use a screen there will be a set of defaults for all of these areas; if you change settings and click Run, the new settings will remain in effect the next time you visit the screen.
Notes:
NOTES
- There is a 10,000 resource limit for retrieving data - use a filter to reduce the results set.
- If displaying in Percent and there is demand but no capacity, the value will be reflected in report output as an asterisk ( * ). This is because division by zero cannot be expressed as a percentage. No capacity AND no demand is represented as 0%.
- If you want to exclude staffing allocations associated with closed projects, configure the project filter to include only open projects (Implied Status = Open)
|
Capacity & Demand Controls and Filters |
Description |
|---|---|
|
Detail Level |
Specify the depth of information to display. The deeper the hierarchy, the more granular the details. For Resource Cap & Demand: For Organization Role Cap & Demand: For Project Staffing & Demand: |
|
Start Date |
Choose the date from which to start presenting data. |
|
Period |
Set the frequency with which to present data, starting at the Start Date. Options are Days, Weeks, Months, Quarters. |
|
Number |
Choose the number of periods. Each period has a maximum quantity: |
|
Unit |
Total capacity: calendar working hours for specified period x capacity multiplier Actual capacity: total capacity hours minus events divided by total capacity hours as defined by the resource's calendar for the time period Choose how to display the data:
|
|
Role, Project, Resource Filters |
Filters allow you to retrieve data from entities with specific characteristics. For example, you might want to view data on all projects with a status open, for resources that are full users, in all roles. The filters available depend on the type of capacity and demand screen. For Resources, the Project and Resource filters are available. For Organization Role, the Project and Role filters are available. For Projects, all filters are available. If you are using the capacity and demand screen for a specific resource, the Resource filter is not available; if you are using the capacity and demand screen for a specific project, the Project filter is not available. You can create new filters by selection >>Manage Filters... at the bottom of any filter drop-down list. See Creating Filters for more information. |
For Capacity and Demand reports, the list of potential rows should be the intersection of the results from all of the filters. For example, in a Resource capacity and demand report, the list of possible rows are the resources from the resource filter that are also part of the team for any of the projects in the project filter.
Hide Rows with zero values option
The list of rows in the result can be reduced by using the "Hide Rows with zero values" check-box. If this detail is selected, for Resource Capacity & Demand, if ALL of the selected "Schedule" columns (Allocation, Schedule, HTC, Actual) have zero values, the row is eliminated from the result. For Organization Role Capacity & Demand, if ALL of the selected Allocation and Schedule columns have zero values, the row is eliminated from the result.