Grouping and Sorting List Reports
This video demonstrates the grouping and sorting controls available in PPM Pro reports. Duration 5.5 min.

The ability to group and sort data applies most often to List reports. Reports that have axes, such as bar/column charts, have simple sorting capabilities, such as ordering the axis values or bars/columns, or ordering by count so that the bars/columns are ordered in increasing or decreasing size. Grouping/sorting options for all reports types are configured on the Display tab (you can also configure list report sorting in the Preview Pane). In addition, the Display tab offers an additional section for creating stacked list reports for the List:Stacked report Type.
This topic covers the following for list reports:
- Sorting, grouping, and totaling data
- Aggregating data
- Sorting by aggregation results
- Grouping on a hidden field
- Grouping on a multi-select field
Sorting, Grouping, and Totaling
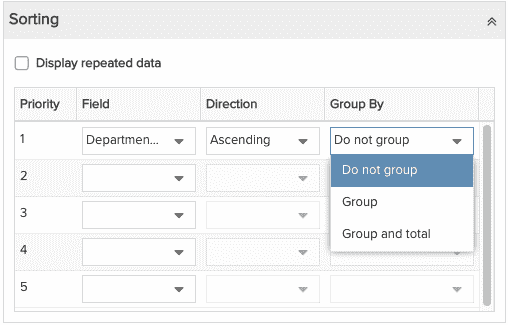
You configure sorting, grouping, and totaling in the Sorting section of the Display tab, shown below. This Field droplist contains all fields you chose in the Data tab. Select up to 5 sort fields and note that he rendered report is sorted by Priority, so pay attention to the order. A value may appear only once in the list; to reorder the list you might have to temporarily set a field to blank, reselect the value in the new position, and then replace the blank with the desired value, if necessary. Any field you sort on can also be a Group By field.
The screenshot below is the Sorting section on the Display tab for a list report.
 |
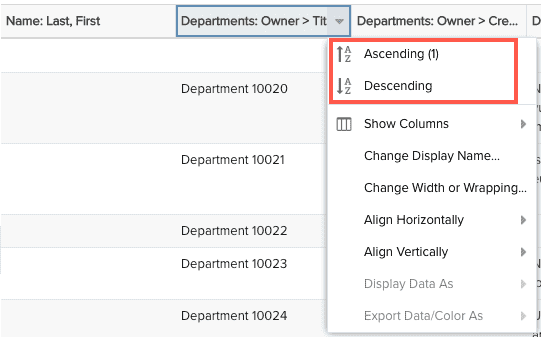
Sorting in the Preview Pane Remember that you can also configure sorting directly in the Preview Pane by using the column header menus.
It's generally easier to sort using the Sorting grid as you can see all the sort fields in one glance. Regardless of which technique you use to sort, the alternate technique will stay in sync. There is no way to group using the Preview Pane. Grouping and Totaling
|
Displaying vs Suppressing Repeat Data
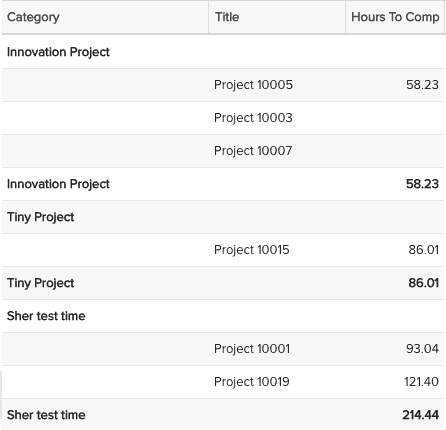
Enable this setting if you have grouped your report by at least one field and you want to display the repeated data (the "group by" value). By default this setting is disabled (unchecked), meaning the data will not display. For example, if you have a Project report and you group by project Owner, the Owner value will NOT display on the row with every project owned by each resource - it will appear once for the group. If you wish to see the value on each record, enable this setting. See the example below.
|
|
|


Aggregation
The Aggregation section is where you choose the aggregation operation for numeric fields. All numeric fields included in your list of fields will appear in the Field column. If you have not included any numeric fields in your report, the Aggregation section will not appear. Note that if you include the Count field in your report, it also can be aggregated.
|
|
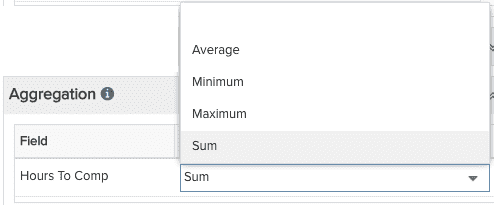
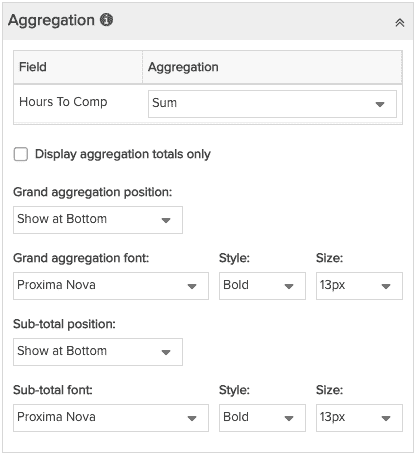
Provided you have at least one numeric field in your report, you will see the Aggregation section - the example to the left shows the Hours To Comp field, which was selected for the report in the Data tab. Aggregation does not happen unless you pick an aggregation method from the drop list. Aggregation - Choose the aggregation type. The following types of aggregation are supported: Average, Minimum, Maximum, and Sum. Aggregation is available only for fields that make sense. For example, you cannot Sum on Title field values (and Title would never appear in the list of possible fields to aggregate), but you can sum the value of Hours to Complete. Once you apply an aggregation to a numeric field by selecting the Aggregation type from the drop list, another set of controls appear for configuring attributes of the aggregation value(s). Display aggregation totals only - You can render the entire report, including sub-totals and a grand total, or you can render the sub- and grand-totals only. See example below. Positioning totals values
You total without grouping to get a grand total. |
Displaying Aggregation Totals
You have the option of displaying aggregation totals with your report content, or just the totals themselves - examples of both shown below:
|
Display aggregation totals with report content
|
Display aggregation totals only
|
Sorting by Aggregation Results
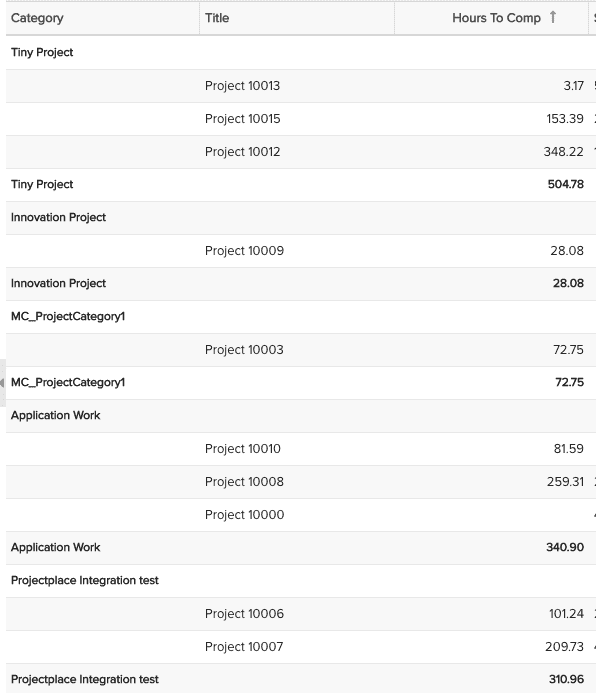
You can sort a report according to the results of an aggregation by sorting with the aggregation field. For example, say you have grouped your report by project Category, and then want to sort the categories by the sum of Hours to Complete for each project category.
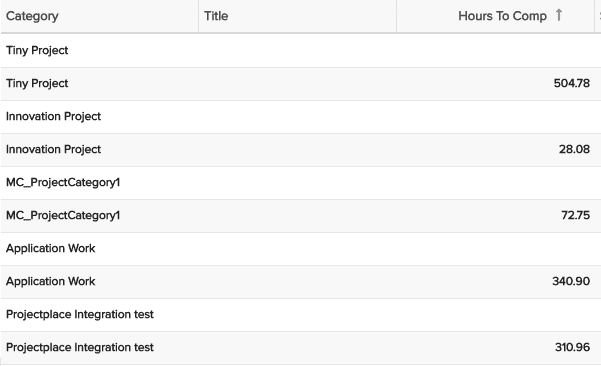
Once you select a field in the Sorting section, such as project Category, you can sort your report according to the aggregation results of a numeric sort field by choosing "Group and total" for the Group By. For example (assuming the Grouping field = Category), apply an aggregation (such as Sum) to the numeric field Hours to Complete. Each value of that field will be sorted in each group, and then each group as a whole will be sorted by the aggregated value of that field. See setup and example output below:
Setup: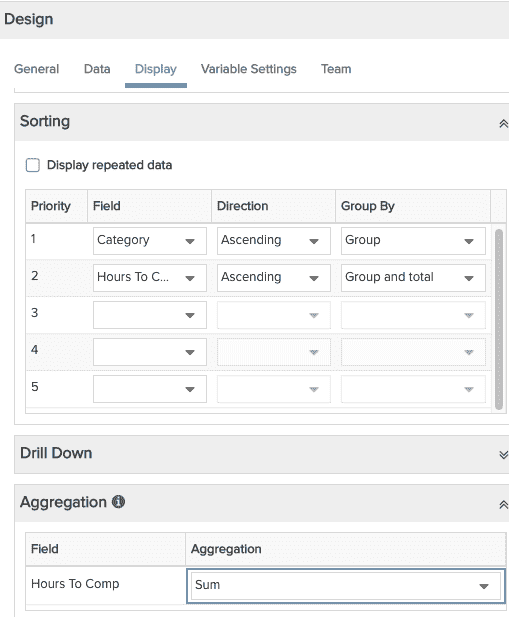 |
Report grouped by category, but sorted by sum of Hours to Comp for each category, lowest to highest.
|
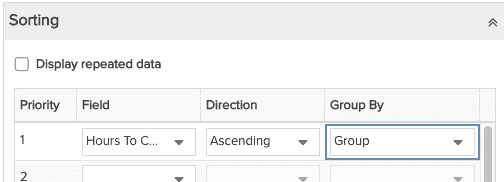
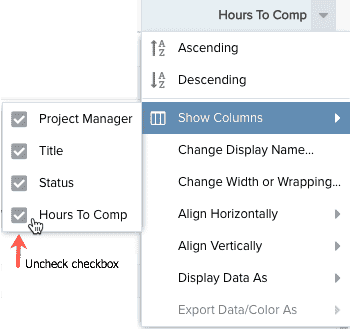
Sorting/Grouping on a hidden field
If you want to group on or sort a field but not display it, you can use the column header menu - Columns sub-menu - to uncheck that field to hide it. The field remains available as a Sort or Group By field. For example, the screenshots below show how to group by Hours to Complete, and then hide the field from the report.
|
Group by Hours to Complete
|
Hide field - you can hide/show from any column header
|
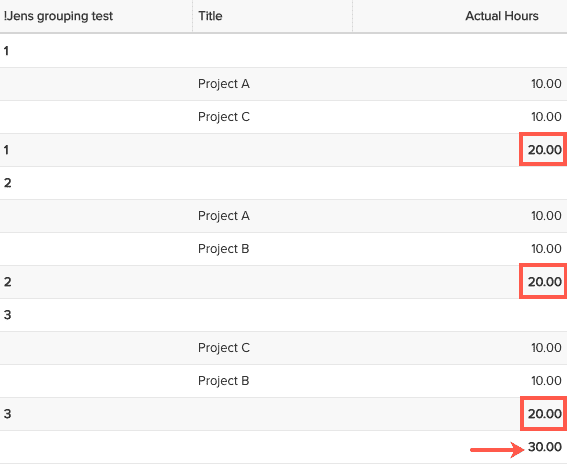
Grouping on a Multi-select Field
When grouping by a multi-select field, be aware that sub-total counts could include repeated data. However, the overall total count will be correct. For example, say you have a multi-select field called Numbers that contains the values 1, 2, and 3, and you have 3 projects: Project A, Project B, and Project C. Each project is assigned the values below:
- Project A is assigned list values 1, 2
- Project B is assigned list values 2, 3
- Project C is assigned list values 1, 3
Create a report summing actual hours for the projects; group the report by the multi-select list field Numbers. Your output will look like the following: the subtotals are correct - 20 hours each - but the grand total is 30, which is correct (although the subtotals imply the grand total is 60).