Financial Summary Full Structure
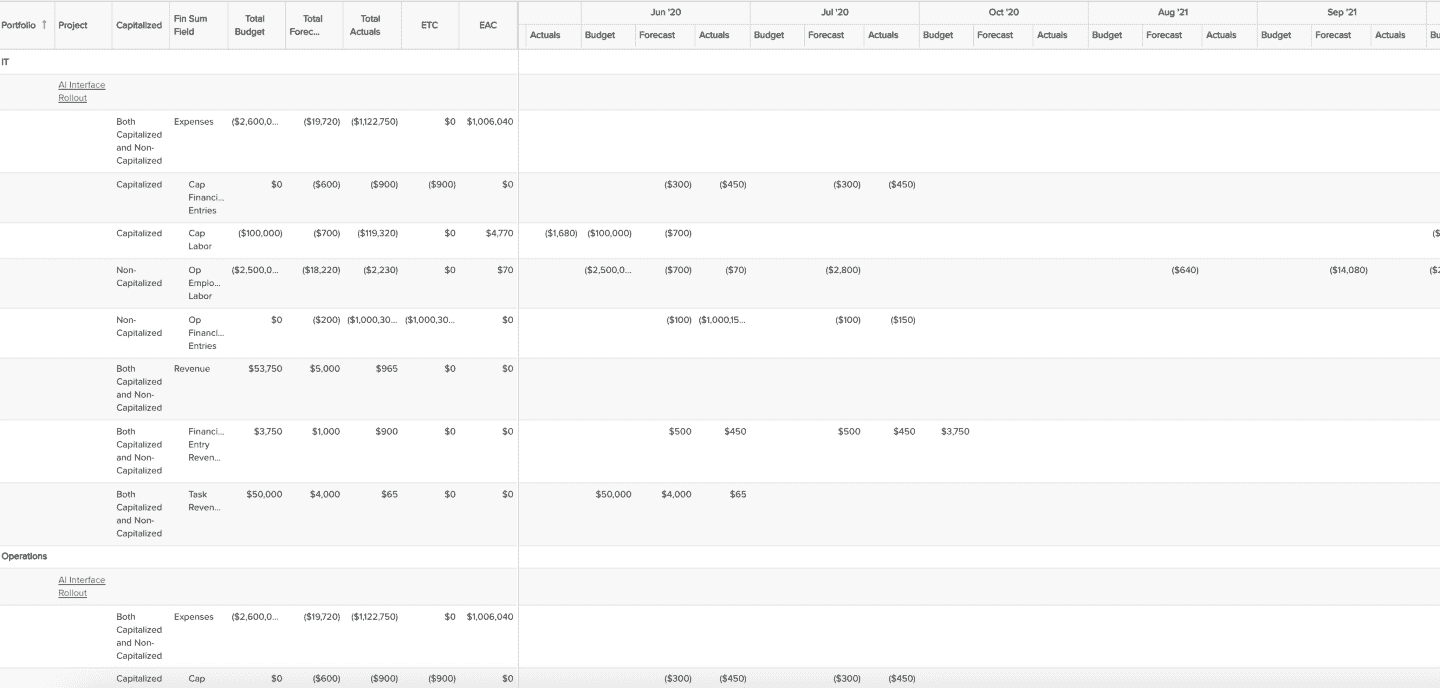
Provides a report across portfolio projects, displaying their complete financial summary structure with budgets, forecasts, and actuals over time (if you do not want the full structure, please see the Financial Summary Top-Level Structure recipe). NOTE that this report can be tailored to a single project or projects and care should be taken to constrain the variable settings filters and time series as possible because it can take quite some time to run, as it calculates and renders all the data. If you have a need to span portfolios or projects, we recommend you place it on a dashboard with scheduled publishing so that it will be immediately updated with much better performance when viewing the published version. You can build this report using the design settings in the table below. Alternatively, you can download this report definition and upload it to your PPM Pro instance.

| Design View | Selection | Comments |
|---|---|---|
| General |
Topic: Project Specialty: Time Series Type: List: Time Series Title: <enter a meaningful title>
|
Note that for reporting on financial summary structures, the List: Time Series is the best report type to use. |
| Data |
Note that selecting Financial Summary fields with '(Signed)' in their labels will show costs/negative field values inside parentheses while revenue/positive field values will not be in parentheses. If you do not have revenue/positive fields in your Financial Summary structures, then you can simply select fields without '(Signed)' to show costs/negative field values without parentheses. List Fields: Add whichever of the following and others would be of value, such as Project available fields and Project > Financial Summary field path available fields:
Time Series Fields: Only available fields that have '(Financial Summary - Time Series)' appended to their titles should be added to this section. From the Project available fields add:
|
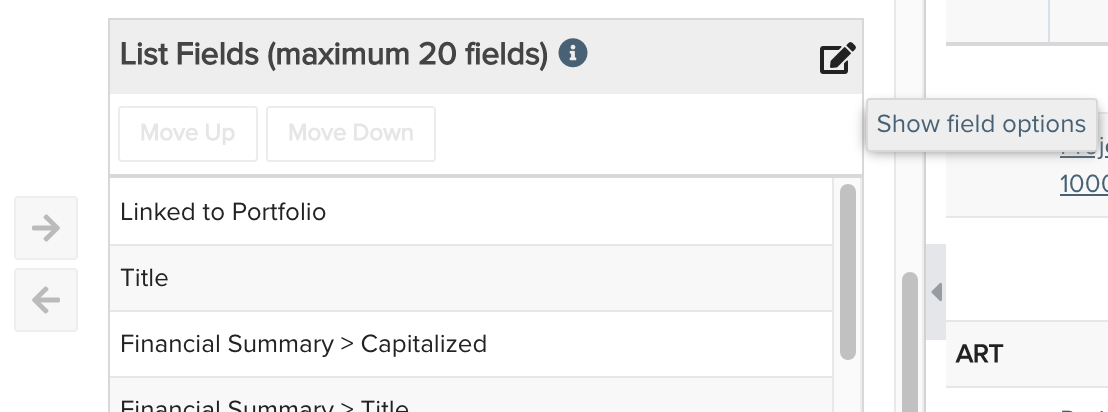
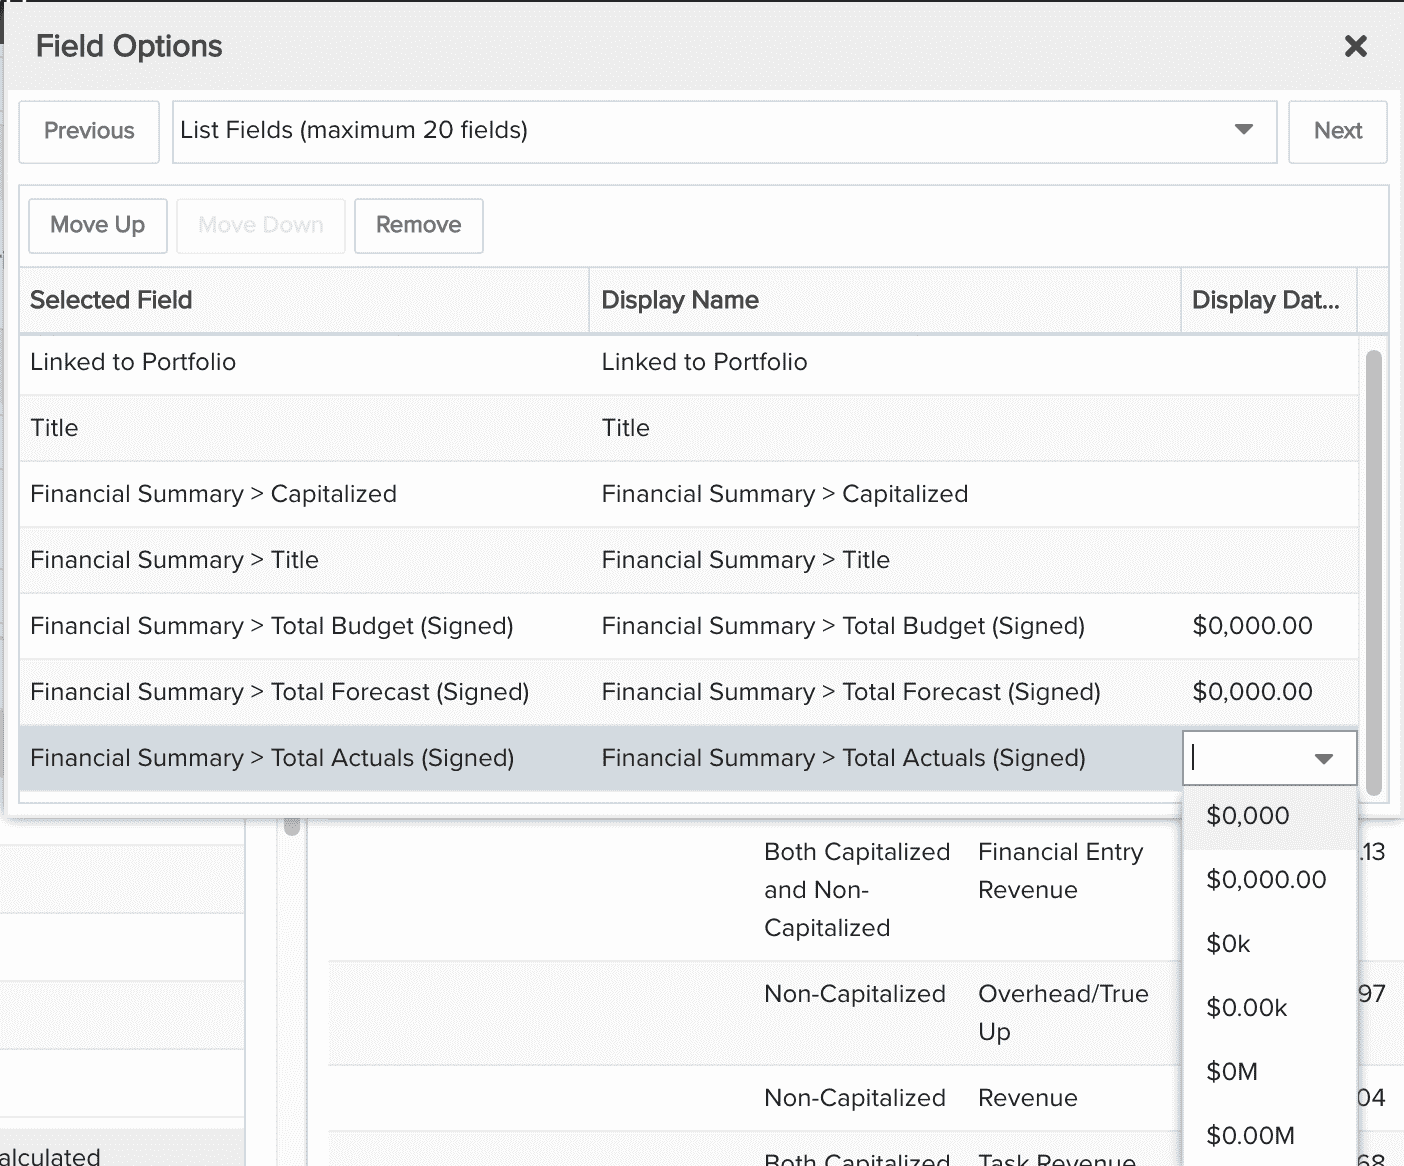
To change the data field Display Name or Display Data As, for example from "$0,000.00" to "$0,000", within the List Fields or Time Series Fields area titles select the edit icon for "Show Field Options" and in the resulting "Field Options" modal, edit the field options.
|
| Display |
Configure desired options within the Display tab, such as:
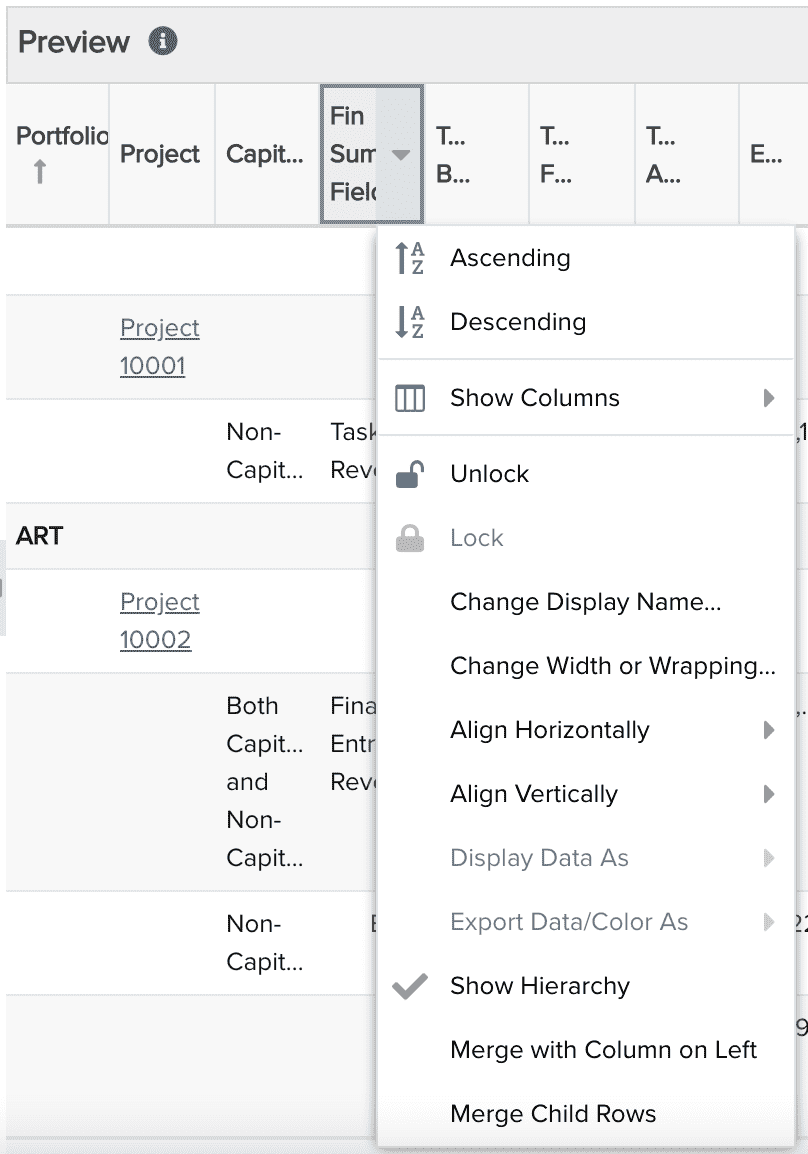
Within the Preview pane, select the Financial Summary Title column's options menu and "Show Hierarchy" to represent the summary hierarchy. NOTE that you must select Show Hierarchy for the financial summary structure to be rendered correctly. If you do not, then you will only see the top or first-level fields in the summary hierarchy.
|
 |
| Variable Settings |
Set desired Time Series options, providing filters and dates as possible to reduce the time it takes to render the report, such as: Scope: Select Portfolio and Project if you want the report to be available to be run from those report grids Filters: Any project filters Time Series: Note that if you select a time series period that is narrower than the actual financial data on a project's financial summary (such as 'is prev 6 months' but there is actually financial data outside of the 6 month period), then the Project Total financial summary field values may differ than the Time Series right hand Total fields. |
|


