
Working with the Task List
The Task list consists of three panes: the work breakdown structure (WBS) presents a hierarchical list of all tasks that meet your filter criteria. You can format task grid data (for example, add color, format dates, time, and currency) using the "Display Data As..." feature - see Formatting Column Values below.
A Gantt chart can provide a visualization of the textual WBS, and can be customized as to exactly what data is highlighted and how. A Task Timeline can allow you to visualize your project timeline and key tasks, especially how they are impacted as you make changes to other tasks. Finally, the Task Info pane contains a set of tabbed sections (the specific tabs that are displayed depends on how your organization has designed the task category(ies)) that support different a aspects of tasks. For example, the Details tab is required, but there are additional sections for estimating/scheduling, creating association, adding notes and attachments, and configuring alerts.
There are three access points to the tasks list:
- Open a project and click the Tasks link in the left-nav pane. This view presents tasks within the context of the current project.
- The Home/Tasks page is a filtered view of all the tasks that you own or are scheduled to, and which belong to projects whose implied status is not equal to Closed. This page has a subset of the functionality found on the project Tasks page - notably the ability to create and delete tasks is not supported on this page, and there is no Gantt view.
- The spreadsheet style editor, although also accessed from the project Tasks link, provides an alternative editor for working with tasks.
Anatomy of the Task List
As mentioned above, the Task list provides a hierarchical list of tasks on the left-hand side (WBS), includes a Gantt chart that can be hidden or shown, and shows a set of tab in the Task Info pane that you can use to manage different aspects of a task. When you select a task in the WBS, the relevant information for that task for whatever tab is active is displayed in the Task Info pane. You can expand/collapse the different panes to display only the WBS, or only the Task Info pane, by clicking any of the collapse tools (shown below), and you can use the splitter to resize the two panes.
NOTE
The task WBS grid includes an Info column that is required; it appears by default and cannot be removed. This column is used to display informational system messages/icons, such as when there are scheduling conflicts or a unique calendar is being used. You can drag the column to the right to move it out of the way/make less conspicuous.
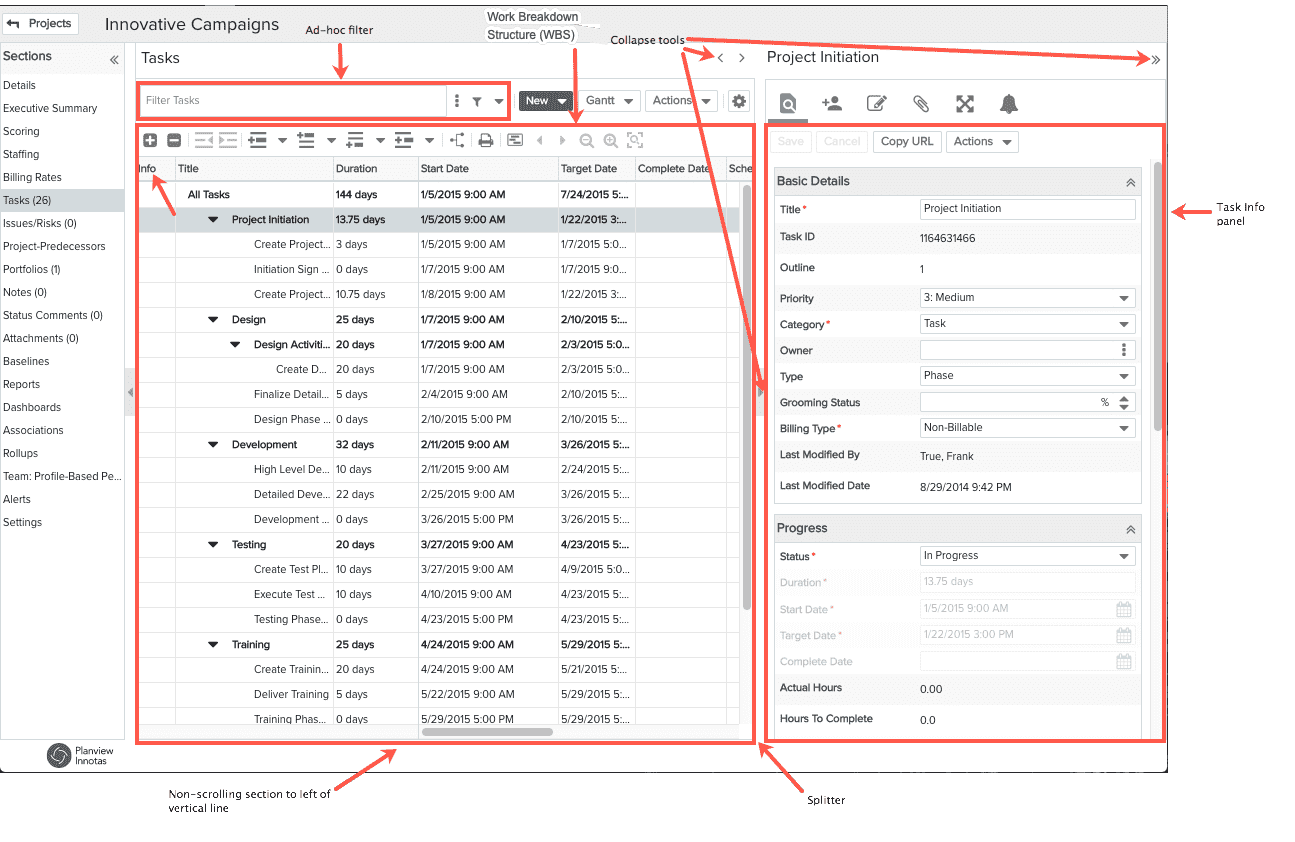
The All Tasks record at the top of the task WBS displays the earliest Start Date and latest Target Dates of any (dated) task in the WBS - provided you are using date-centric tasks for at least part of your WBS; other rolled-up totals are informed by task estimates and/or schedules, if using. Additional details for each task are displayed in the Details tab of the Task Info panel. When you make changes to the Task Details, the Task List automatically updates after you Save. Note that while you are editing the Task Info, the Task WBS is inactive until you save your changes. If using iterative methodologies, you might not see any data in the All Tasks row as dates are not required for IW tasks (see Using Tasks for Iterative Work), and IW tasks preclude the use of schedules.
NOTE
For best results, we recommend limiting the number of tasks per project to 1000. If more than 100 tasks are expanded, either manually or via the Expand All button, only the first 100 tasks will be expanded on subsequent loads of the data. For example, imagine you click Expand All, then apply an ad hoc filter that returns 500 records - only the first 100 records (of the 500) will be expanded. If you want all tasks expanded again, click the Expand All button.
Refer to Keyboard Shortcuts for a list of keyboard and toolbar shortcuts.
Editing the WBS
Select single records by single-clicking; use shift-click to select multiple records (or hold down the shift key and hit the down arrow key repeatedly). When you select more than one record, the message "n items selected" is displayed (temporarily) in the footer of the page. This is useful if you want to select a range of records and want to know the count.
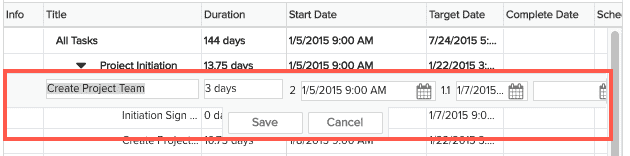
To edit fields inline in the WBS, simply double-click a row to activate. You can use your mouse and/or keyboard navigation. Tab moves you from field to field and to the Save/Cancel Buttons. Use arrow keys to move you through drop lists and suggested matches (for picklists) and use Return/Enter to make your selections. An active inline record is shown below:
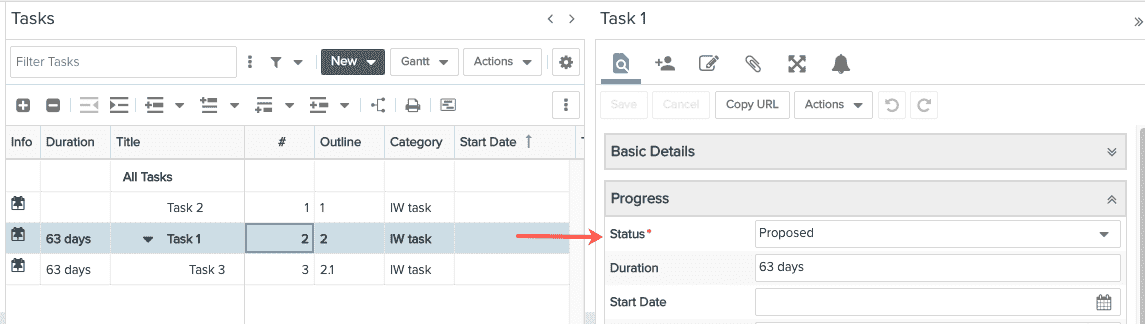
You can also single-select a record and edit fields in the Details panel using the same keyboard gestures, with the addition of Ctrl-S to save. Use Esc to undo an edit that hasn't yet been saved. A selected record and its corresponding Details is shown below:
Newly Created or Edited Records
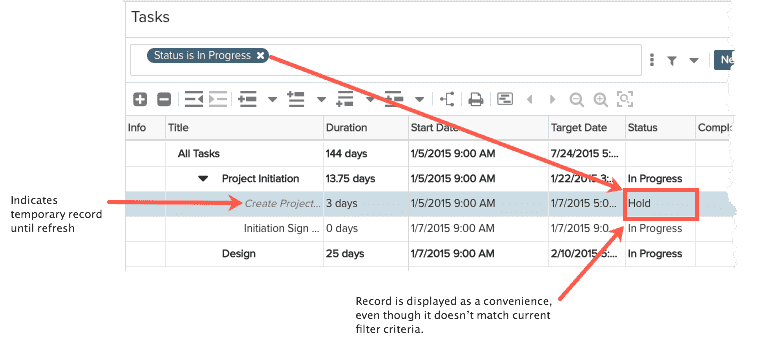
Note that you might find yourself in a situation where you have set up some filter criteria to populate the grid. Then you create a new record, or modify an existing record in such a way that it does not meet the current criteria (or might fall outside the scroll region). For example, your filter might specify "Status is In Progress," but you updated a task status to "Hold". Because we assume that you still might want to make additional edits, rather than immediately filter the tasks out of the list, PPM Pro keeps the task record in the list and makes it italicized. You can continue to edit until you navigate away from the screen. Any records that don't meet the current filter criteria, will be removed after refreshing the screen.
The New Menu
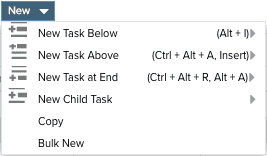
The New menu contains operations for creating tasks. All operations except New Task at End and Bulk New assume that the operation is relative to the currently selected task.
When you create a new task, the task is created using the default category. If your organization uses only one task category (we expect this to be the most common case), then you will simply see a simple New menu, like below:
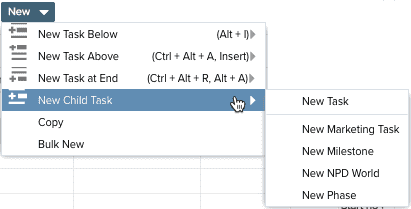
If your organization has implemented multiple categories, then you will see an addition pull-right menu that contains the additional category(ies). The default category is configured by your administrator, and is the first category in the New Task menu. Note that there is a project setting called Default Task Category that can override the value set by your administrator. If you click the menu without sliding to the right, the default task will be used when creating the task. Otherwise, select the operation you want to use, and slide the cursor to the right and then choose the category.
The Actions Menu
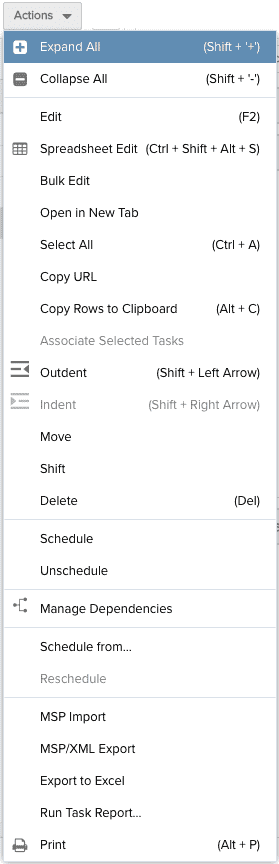
The Actions menu at the top of the list holds all operations that you can perform on tasks in the list. You can also access this menu by right-clicking on a task. Perform bulk actions by selecting multiple records (Shift-click or Ctrl-click) and then choosing an operation from the Actions or right-click menu.
 |
Menu Option |
Description |
| Expand All |
Expands the entire list of tasks (opens all branches). If more than 100 tasks are expanded, either manually or via the Expand All button, only the first 100 tasks will be expanded on subsequent loads of the data - for example, after running a filter or leaving and returning to the Tasks list. If you want all tasks expanded again, click the Expand All button. |
|
| Collapse All | Closes the list of tasks (collapses all branches) | |
| Edit | Invokes the inline editor for the selected task. | |
| Spreadsheet Edit | Invokes the spreadsheet-style editor for the entire WBS, not just the selected task. | |
|
Bulk Edit |
Opens an editor that allows you to edit multiple tasks. Select the task (Shift-click or Ctrl-click to select multiple rows) and then choose Bulk Edit. See Bulk Editing for more information. |
|
|
Open in New Tab |
Open the selected task in a new tab. |
|
| Select All | Selects all the tasks in the list. | |
| Copy URL | Copies the URL to the current task. | |
|
Copy Rows to Clipboard |
Copy the selected rows to the clipboard. (Shift-click or Ctrl-click to select multiple rows.) |
|
| Associate Selected Tasks | Create associations between the selected tasks. For example, if you select Task A and Task B and the choose Actions > Associate Selected Tasks, Task A will appear in Task B's Associations tab, and Task B will appear in Task A's Association tab. This is a shortcut for creating the association as you don't have to search for the task to associate - you can just select it (provided it is in the same project). | |
| Outdent | Shifts the selected task(s) to the left. The summary task will be converted to a leaf task if no child tasks remain. | |
| Indent | Shifts the selected task(s) to the right. This option is available only if there is a child task above the task(s) to shift that can be converted into a summary task. | |
| Move | Moves the selected task(s) to a new parent. See Moving Tasks. | |
| Shift | Shifts the start date of the selected task(s). Shifting a task's dates will cause its sub-tasks's dates to shift also, which may cause its parent task dates to adjust accordingly. To shift dates one week, use 5 days (Days=work days Mon-Fri). See Shifting Tasks. |
|
| Delete | Deletes the selected task(s) | |
| Schedule | Provides ability to schedule multiple resources to multiple tasks. | |
| Unschedule | Provides the ability to remove multiple resources from a task. | |
| Manage Dependencies | Invokes the Manage Dependencies dialog, which allows you to create dependencies between tasks within this project or between tasks in this project and tasks in another project. See Creating Dependencies. | |
| Schedule From... | Allows you to reset the Schedule From date for the project. | |
| Reschedule | This menu option becomes available if there have been changes to the project's base calendar. Use this option to reschedule the project to adjust to the changes. You will see an icon in the task Info column that looks like a calendar. This appears when the project needs to be rescheduled. | |
| MSP Import | Provides the ability to import a Microsoft Project. See Importing/exporting tasks. | |
| MSP/XML Export | Provides the ability to export a PPM Pro task plan to an XML file which you can then import into Microsoft Project. See Importing/exporting tasks. | |
| Export to Excel | Export a maximum of 5000 list rows to Microsoft Excel. If you export 5000+ rows, you will be notified that your export will be truncated and encouraged to run a report to accommodate the large number of rows. Reports can handle up to 50,000 rows. See Printing the Tasks List. | |
|
Run Task Report |
Provides a shortcut to access task-level reports. |
|
| Prints the task list to a PDF. See Printing Task List. |
Formatting Column Values
NOTE
The ability to format column values is available for list reports and entity grids (Issue/Project Log List, Portfolio List, Project List, Request List, and Task List). Since this feature works the same way in either context, we are covering it in one topic. You might see references to both entity grids and list report columns.
For entity grids, the formatting is specific to each user - there is not currently a way to specify global formats. Note that if you choose Reset To Default Settings from the resource menu, you will lose your formatting entity grid formatting.
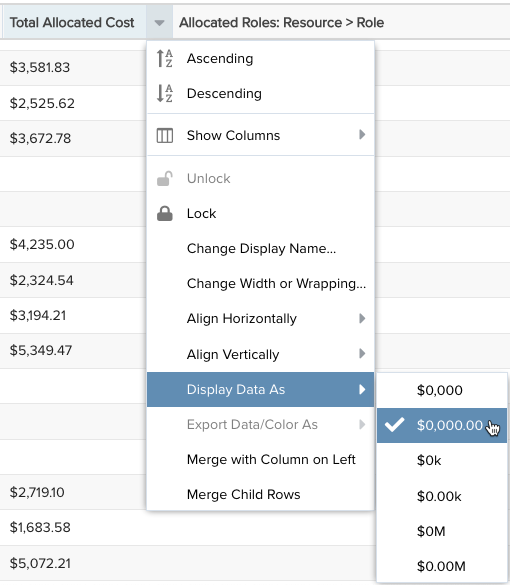
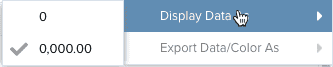
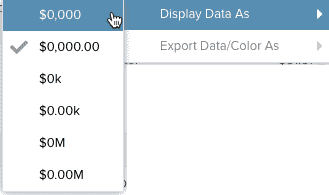
In the context of a List report or the entity grids mentioned above, an extensive header menu option called "Display Data As" is available for applying formatting to list fields, number fields, and date/time fields. The screenshot below (left) shows the Display Data As menu for a numeric fields with a currency data type; the screenshot below (right) show the Display Data As menu option for a list field:
|
Display Data As for numeric (money) fields
|
Display Data As for list fields
|
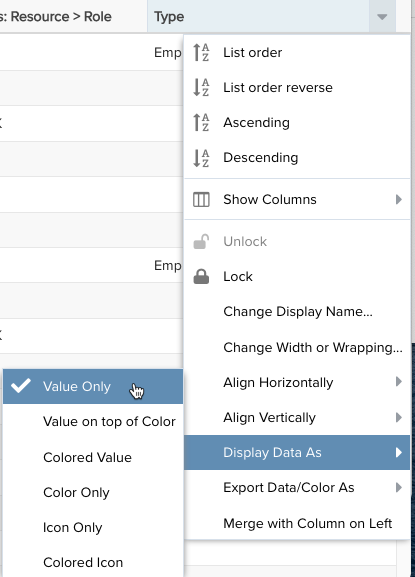
Formatting Data - "Display Data As"
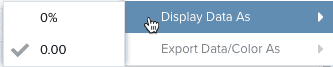
The Display Data As menu header item is dynamic - it displays different menu items depending on the type of field you have selected. For example, select a lookup list and choose Display Data As to apply color to the value in the field, or the background, or both. If you select a numeric field, you'll get various options to specify things like the number of decimal places or currency indicator, whether to format percent fields to display whole numbers or decimals...and so on.
The Display Data As menu options for the different fields types are described below. Note that this menu is also available for entity grids, such as the Projects List, the Requests List, and the Tasks list.
Fields Types:
The formatting options for the above field types are described below:
| Menu Item | Description |
|---|---|
|
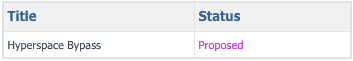
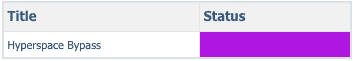
Lookup lists can be assigned a color and/or an icon for each list value. When using a lookup list in a report/grid that is configured to use color/icon, you can choose the visual treatment to apply to the list field value by configuring the "Display Data As" setting. Note that Pie charts and Column charts automatically use any lookup list color assignment.
|
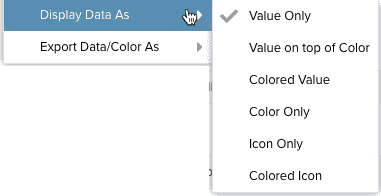
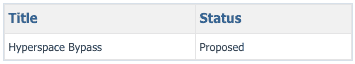
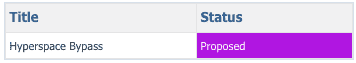
Lookup List Examples: The Display Data As list field options are shown below, along with an example of each:
|
|
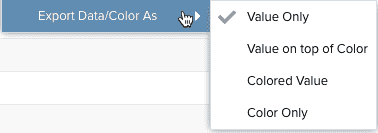
Export Data/Color As If you plan to export a report/entity grid that makes use of lookup list values that render color and/or icons, this options lets you specify how to treat the value/color when exporting. Note that icons cannot be exported as they only exist within PPM Pro.
|
Options are (see Display Data As, above, for examples):
|
|
Note: You can format numeric data values of non-list reports by using the Field Options modal. The following number types can be formatted with the Display Data As menu item: Percent Choose to show decimals or round to whole number.
Float Choose to show decimals or round to whole number.
Money Choose no decimals, 2 decimal places, thousands (k) and millions (M) representatives.
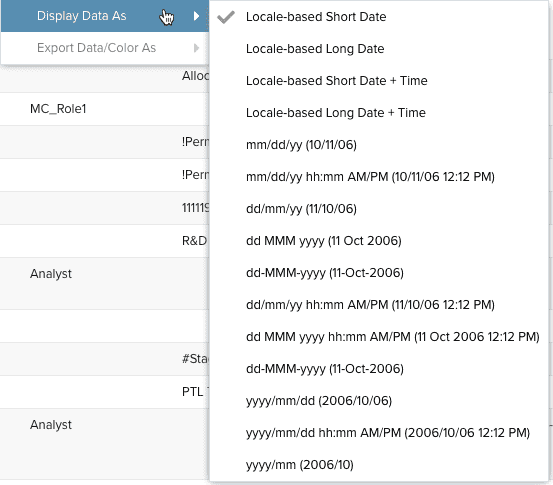
Choose from a large variety of date and date/time formats. Remember that as you choose a format it renders immediately in the Preview Pane, so try out different options. The date format examples are represented in each option label.
|
Values round up using conventional rounding standards - round up at a value of 5 or higher. Understanding the rounding is important when choosing the level of precision you want to use.
Percent Example: 32% or 32.36%
Float Example: 432 or 432.05
Money Examples: $0k $0.00k $0M $0.00M
|
Add/Remove/Rearrange and Sort Columns
You can determine the columns that appear in an entity grid using the Configure Column Settings dialog. Click the Configure Columns gear icon to display the dialog.
![]()
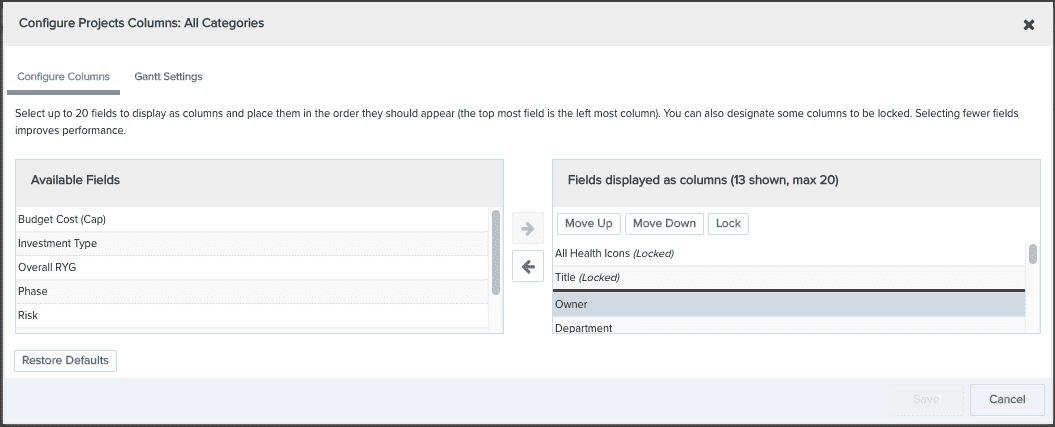
- To add columns to the grid, select them in the Available Fields pane and then click the right-arrow. To remove columns, select them in the right-hand panel and click the left-arrow. You can display 20 columns max. The list of fields available in this dialog is determined by the project category, which is configured by an PPM Pro administrator.
- You can select one or more columns to remain "locked" to the left of the screen in the non-scrolling region, preventing them from scrolling out of view. The Title field for an entity is locked by default. To lock an additional column, select the field and click the Lock button. To move a column into the scrolling section of the grid, select it and click the Unlock button (on appears once you select a locked column other than Title).
- You can move columns to any position in the grid by simply dragging the column header in the grid. Or, you can change their position by clicking the Configure Settings icon and using the Move Up/Move Down buttons to reorder the columns.
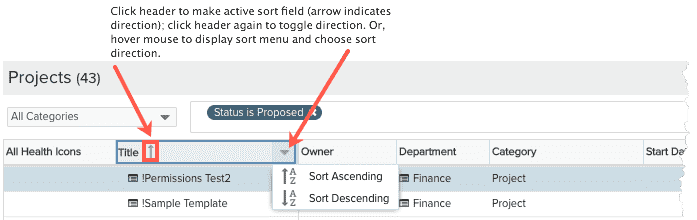
Sorting
To sort a list, simply click on a header. An arrow pointing up indicates ascending sorting; down indicates descending. Alternatively, click your cursor in the header to display the sort menu and choose the sort order - ascending or descending.
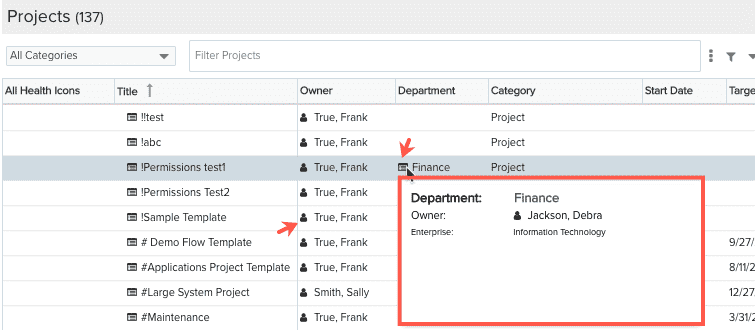
Entity Info Quick View
You can quickly display important information about other entities related to a project without having to navigate away from the Projects lists. Click the ![]() icon next to the name of any entity (such as business unit, department - the resource icon looks like
icon next to the name of any entity (such as business unit, department - the resource icon looks like ![]() ) to display a snapshot for the selected entity. Click the entity name link to navigate to the Info screen of the entity.
) to display a snapshot for the selected entity. Click the entity name link to navigate to the Info screen of the entity.
Out-of-the-Box Task Filters
PPM Pro supplies a set of out-of-the-box (OOTB) filters - OOTB filters always preceded with a + sign :
- Status: +Proposed
- Status: +Open
- Status: +Closed
- +My Tasks - returns all tasks owned by current user or tasks current user is scheduled to. This filter is also available on Home/Tasks, with an additional criterion: Project:Implied Status is not Closed
You can map the status filters to a custom status. This is called having an implied status. For example, you might have a status called "under review," which maps to Proposed, and thus has an implied status of Proposed.
Filtering Tasks
Use the "ad-hoc" filter just as you would on any on page. See Ad-Hoc Filters for more information.
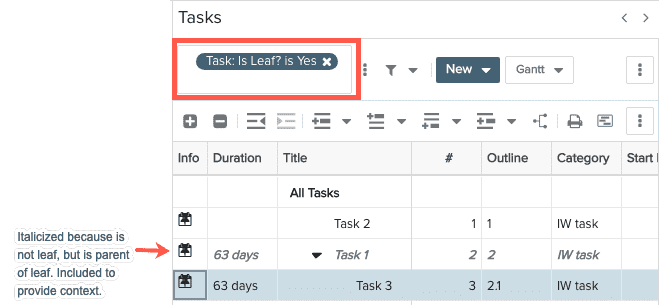
Because of the hierarchical nature of tasks, literal filter results - results that explicitly meet the filter criteria - are sometimes hard to interpret on their own without any context, such as who their parent is.
For example, the Task filter allows you to search for leaf nodes directly. The results are displayed along with the parent node(s) that is implicitly traversed to find the leaf nodes. The parent is displayed in the search results in italics to indicate that it is not an actual result, but provides context for the actual result.
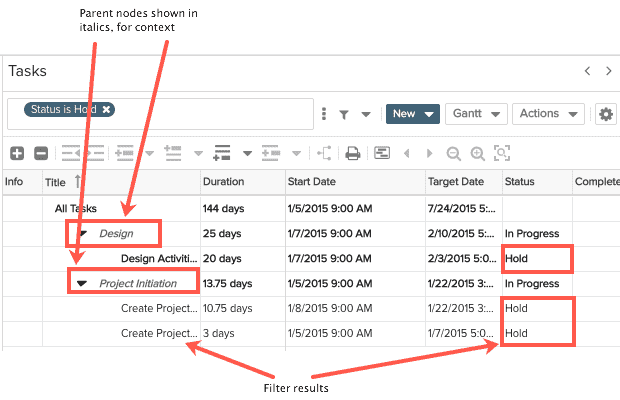
Here's another example: the screenshot below shows the results for Status is Hold. Note that Design Activities and Create Project are the results; Design and Project Initiation - both parent nodes, are just shown for context.
The Details Actions Menu
The Actions menu contains a list of operations for the entity's Details section.
 |
Menu Option |
Description |
|
Log time |
The Log Time option is visible if:
If you do not satisfy the above, you will not see the Log Time menu item. The Log Time link opens the New Project Time window, pre-populated with all required information, including project, task, Org role, current date, and HTC - simply enter your hours. |
|
|
History |
Displays the change History window for the current entity. This window shows a list of modifications made to the entity, including the modification date, who made the modification, the field that was modified, and the old and new values. |
|
|
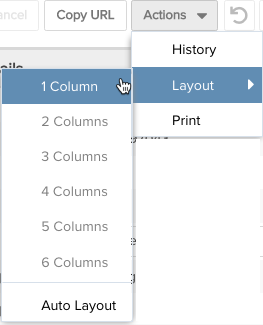
Layout |
Select 1, 2, or 3 column layout (options available depends on the width of your display). Choose Auto-Layout to have PPM Pro format automatically to fit the space. Note that any changes you make on an entity will affect all entity instances of the same category. |
|
|
|
Uses the browser printing facility to print the information on the Details page. |