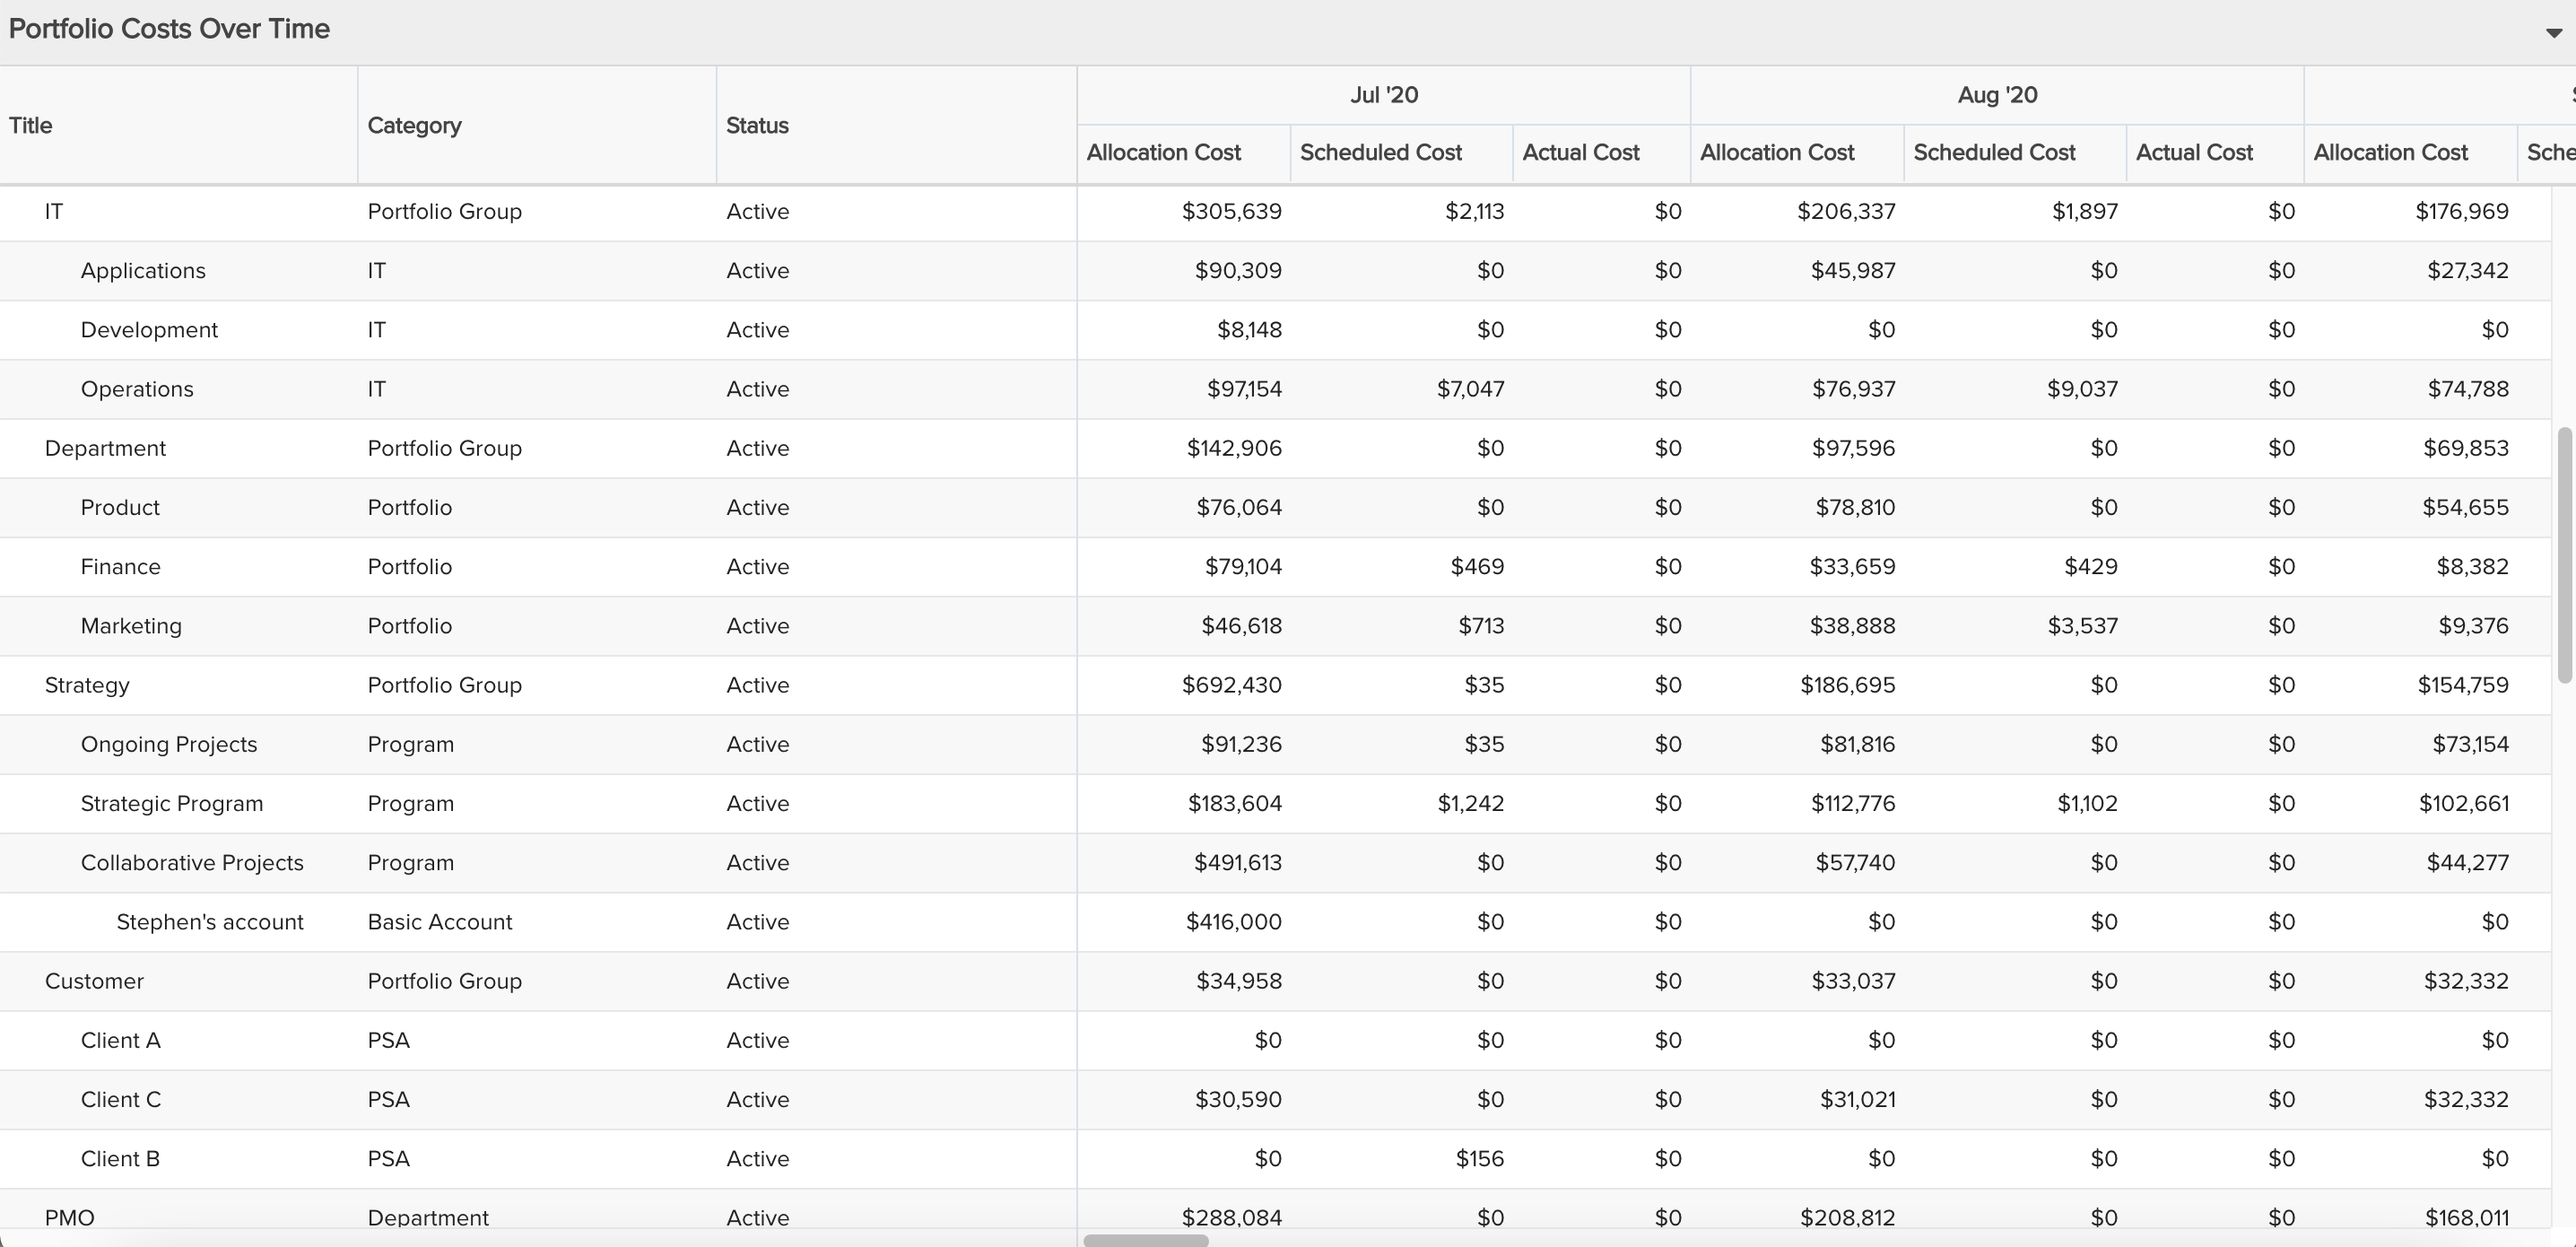
Portfolio Costs Over Time
Compares allocated, scheduled, and actual costs over time for your portfolios. You can build this report using the design settings in the table below. Alternatively, you can download this report definition and upload it to your PPM Pro instance.
| Design View | Selection | Comments |
|---|---|---|
| General |
Topic: Portfolio Specialty: Time Series Type: List: Time Series Title: <enter a meaningful title>
|
Other report Types that work well include Crosstab. |
| Data |
List Fields: Add whichever of the following and others would be of value, such as:
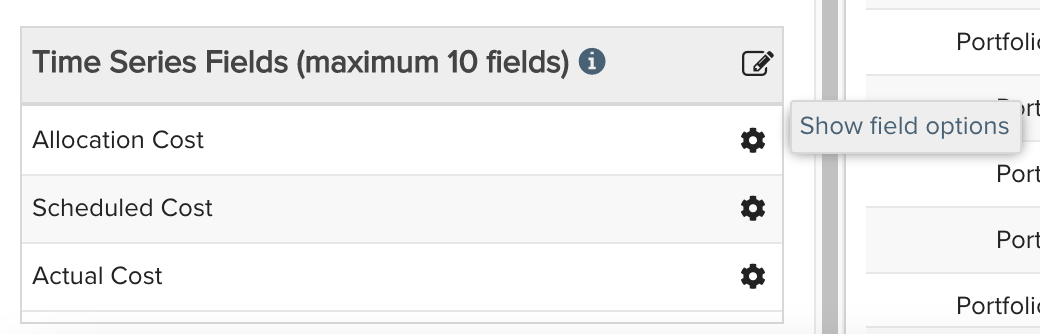
Time Series Fields: Only available fields that have '(Time Series)' appended to their titles can be added to this section. Add whichever of the following and others that would be of value, such as:
|
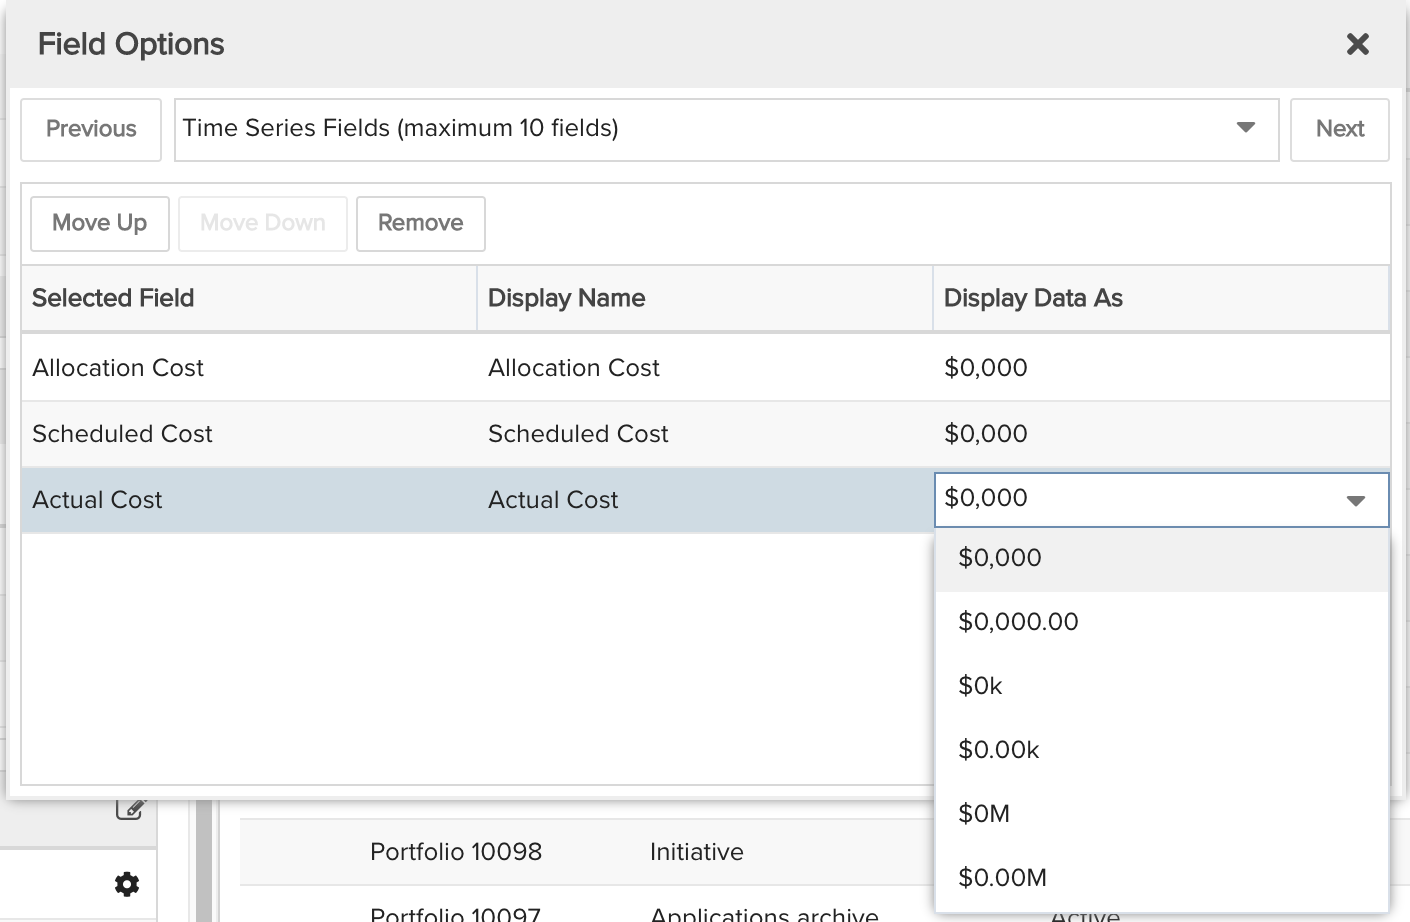
To change the data field Display Name or Display Data As, for example from "$0,000.00" to "$0,000", within the List Fields or Time Series Fields area titles select the edit icon for "Show Field Options" and in the resulting "Field Options" modal, edit the field options.
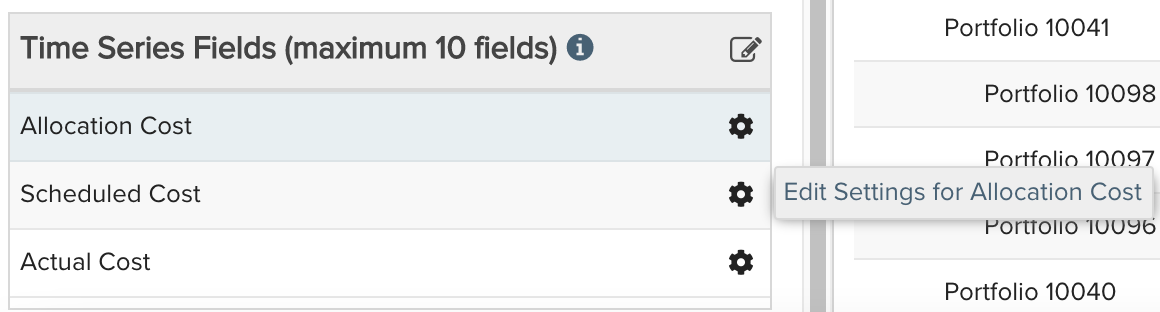
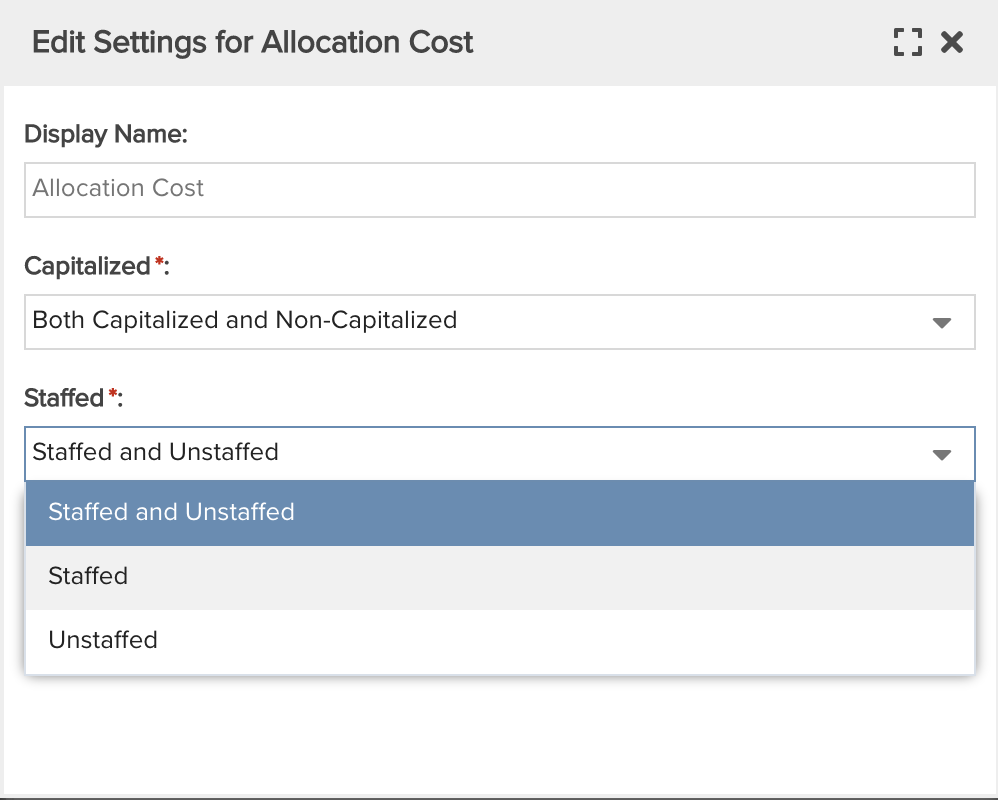
To change the field settings, for example if you wanted to add "Allocation Cost" twice and then edit the field settings for one field to consider "Staffed" allocation costs and the other field to consider
|
| Display |
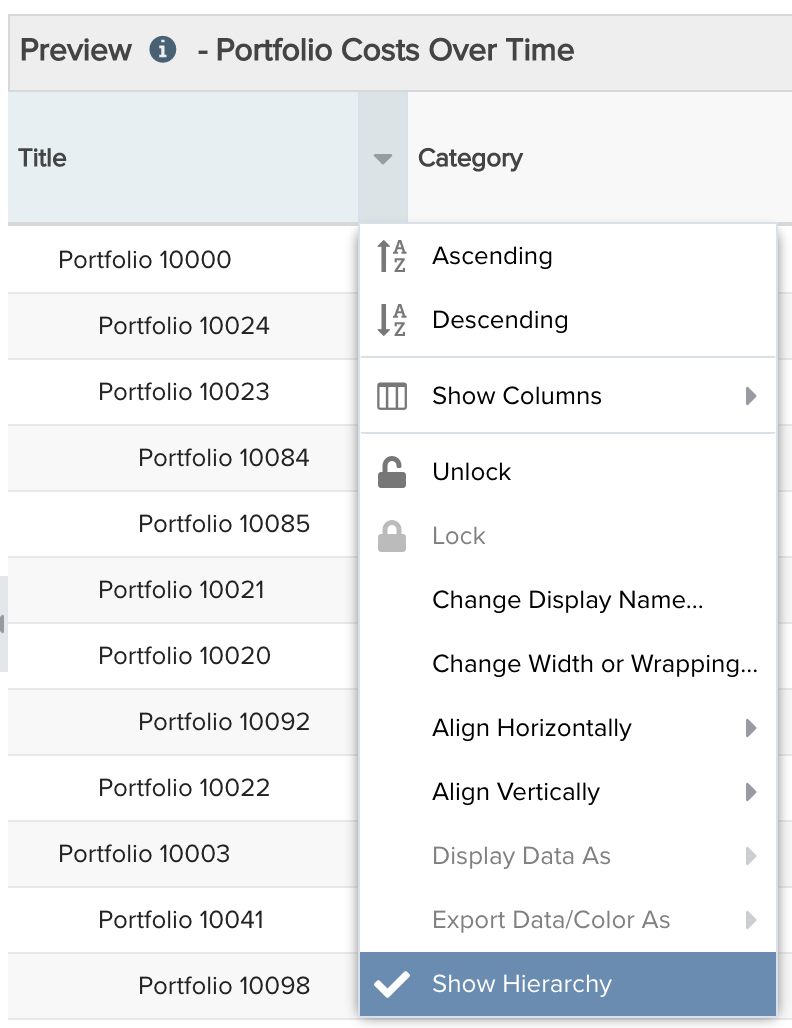
Configure desired options within the Display tab, such as Drill Down. Within the Preview pane, select the Title column's options menu and "Show Hierarchy" to represent the portfolio hierarchy.
|
 |
| Variable Settings |
Set desired Time Series options, such as: Frequency: Monthly Date Range: Is this year |
Selecting the Organization and Portfolio Scopes will cause this report to be available on the Organization Report and Portfolio Report grids so it can be run per the organization or portfolio, respectively. Provide relevant filters, for example if you only want to see portfolios for certain categories. If you want to allow the user to change to a different Filter before running the report or when viewing the report, select the relevant checkboxes for Allow changing. |