Capacity and Demand Report Examples
This topic describes how to build a capacity and demand report similar to the one generated by the Capacity & Demand facility. The Cap & Demand facility pulls data from across all entities and groups into one report based on resource, role and project capacity, allocations, and demands. You will have to build two to three reports to gather all this information manually. Hand-building this report allows you to add or remove fields based on your needs - check the List Options tab in your report for additional customizations. See About Capacity & Demand for information about the built-in facility.
Example Reports
- All Resource Capacity - Column Chart
- All Resource Capacity - Crosstab List
- All Resource Capacity by Resource
- Capacity and Allocation by Role
- Capacity and Allocation by Resource
Note: If you need to compare demand/allocation to role/resource capacity, use the following report sources:
- Resource Planning by Organization Roles
- Resource Planning by Resources
These reports sources already have the summed demand/allocations from the projects.
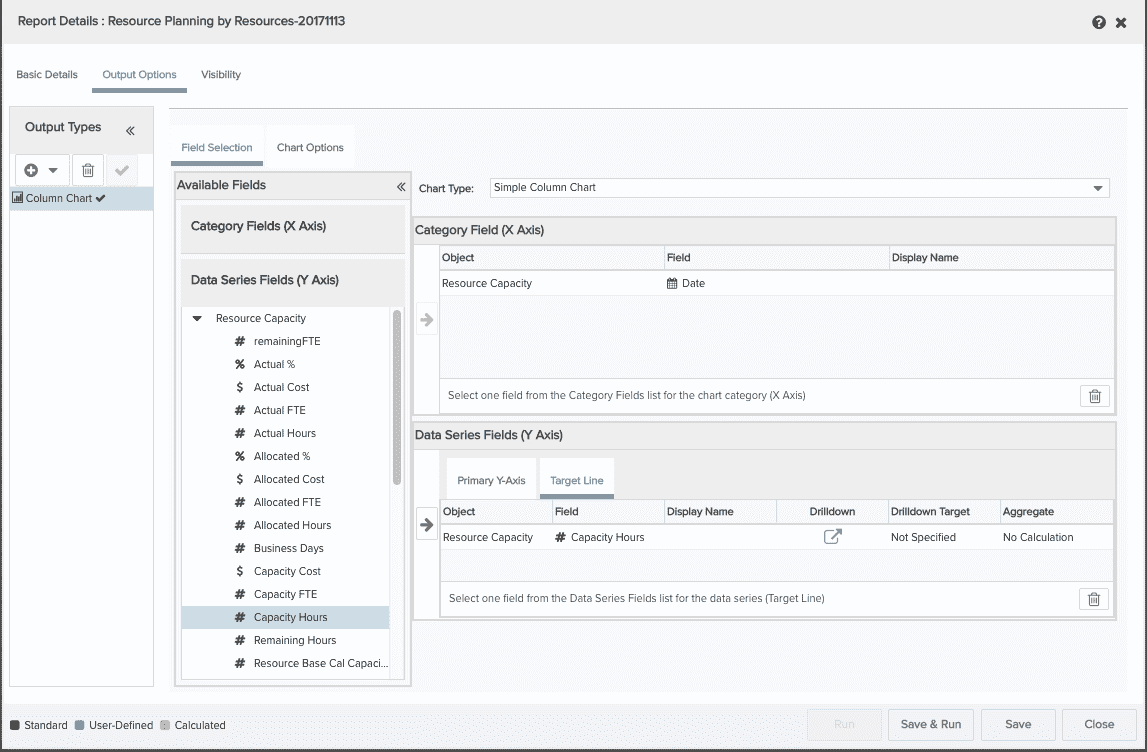
All Resource Capacity - Column Chart
- Navigate to the Reports tab and click the New button.
- Configure the Target and Category droplists: Target = Organization, Category = Resource Planning
- Choose the report source: Resource Planning by Resources
- For Output type, choose Column chart.
- On the Field Selection screen, choose Simple Column.
- Configure the X-Axis fields as follows:
- Resource Capacity: Date
- Configure the Y-Axis as follows:
- Primary Y Axis: Resource Capacity: Allocated Hours
- Target Line: Resource Capacity: Capacity Hours
- Save & Run.
- Select Frequency and/or Filter.
- Run.
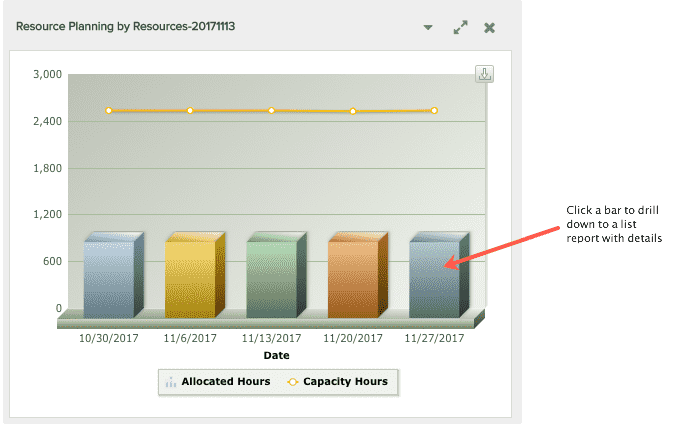
Example Report Output
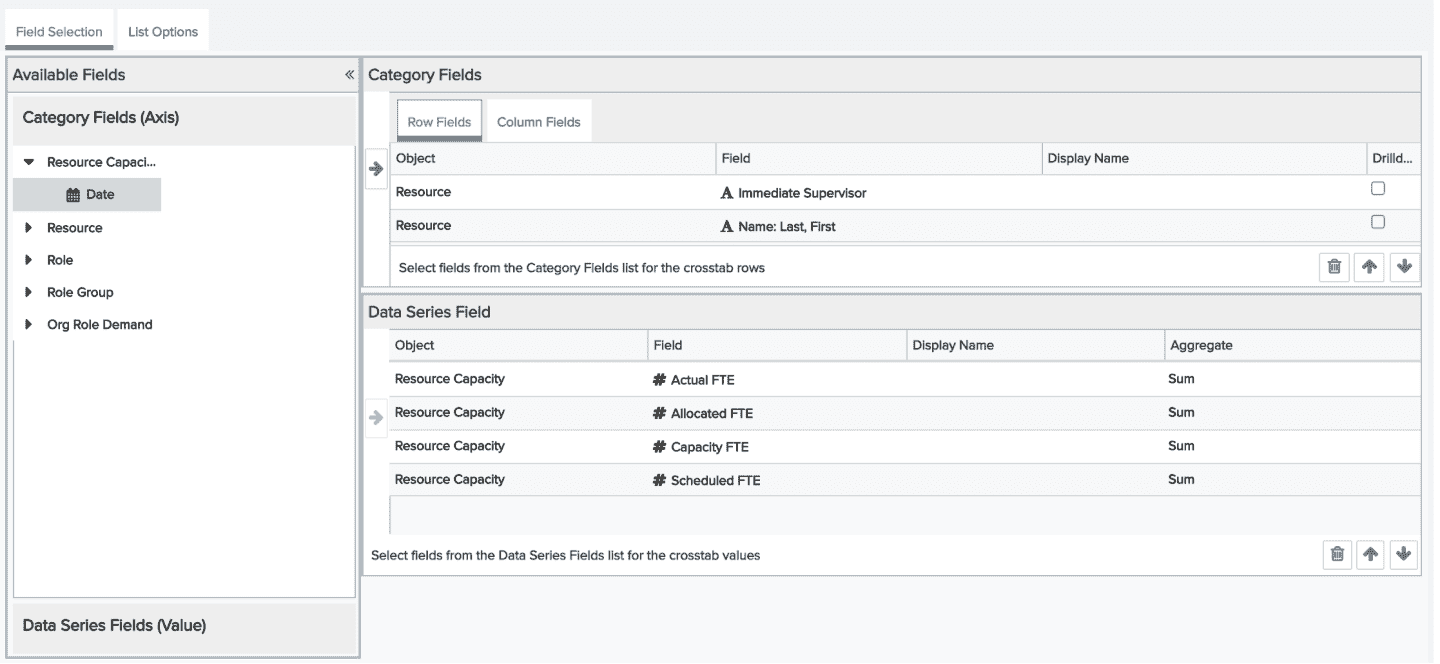
All Resource Capacity - Crosstab List
- Navigate to the Reports tab and click the New button.
- Configure the Target and Category droplists: Target = Organization, Category = Resource Planning
- Choose the report source: Resource Planning by Resources
- For Output type, choose Crosstab List.
- Configure the Category Row fields as follows:
- Resource: Immediate Supervisor
- Resource: Name: Last, First
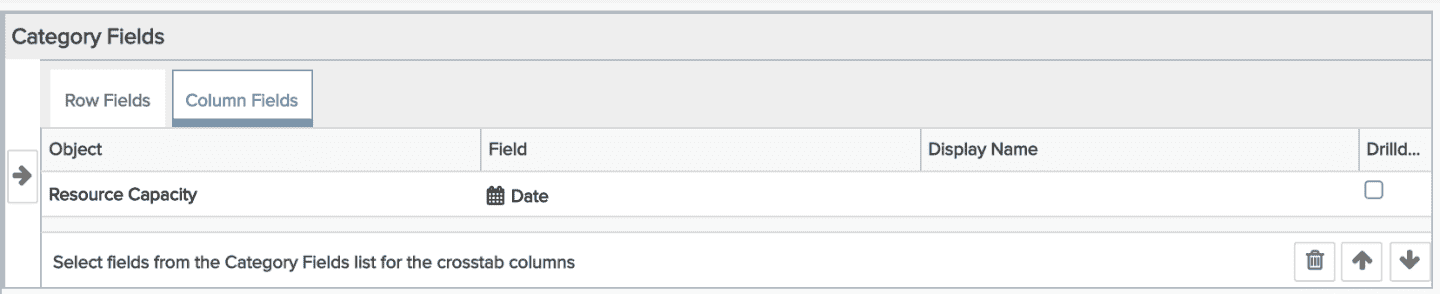
- Configure the Category Column fields as follows:
- Resource Capacity: Date
- Configure the Data Series Field as follows:
- Resource Capacity: Actual FTE
- Resource Capacity: Allocated FTE
- Resource Capacity: Capacity FTE
- Resource Capacity: Scheduled FTE
- Save & Run.
- Select Frequency and/or Filter.
- Run.
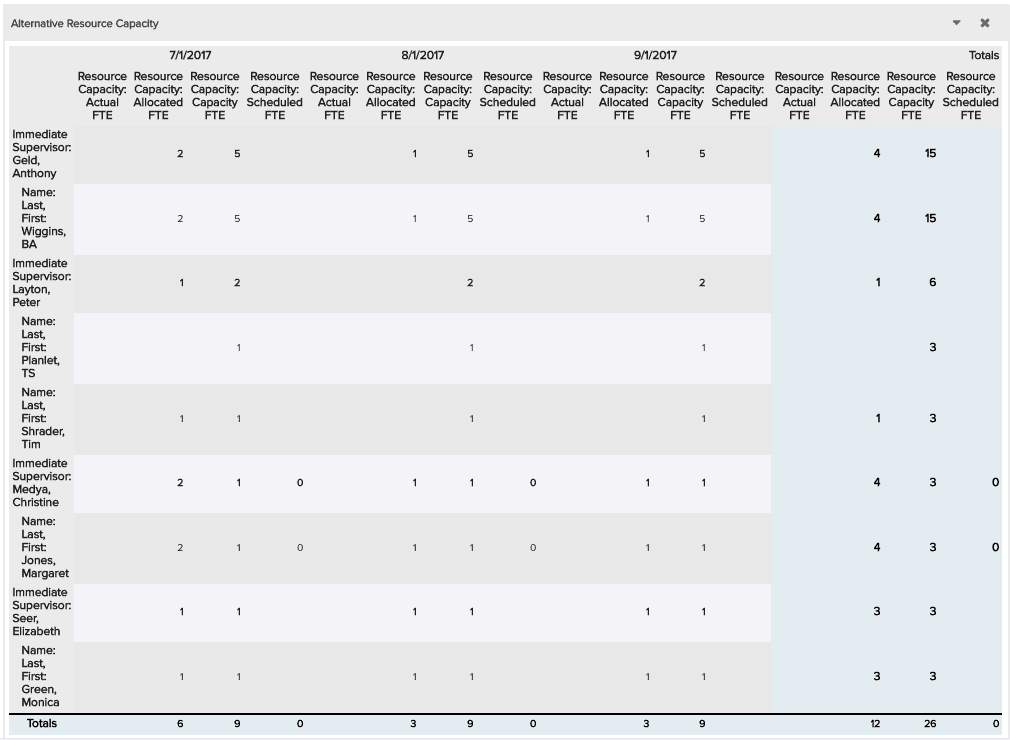
Example Report Output
All Resource Capacity by Resource
- Navigate to the Reports tab and click the New button.
- Configure the Target and Category droplists: Target = Organization, Category = Resource Planning
- Choose the report source: Resource Planning by Resources
- For Output type, choose Column chart.
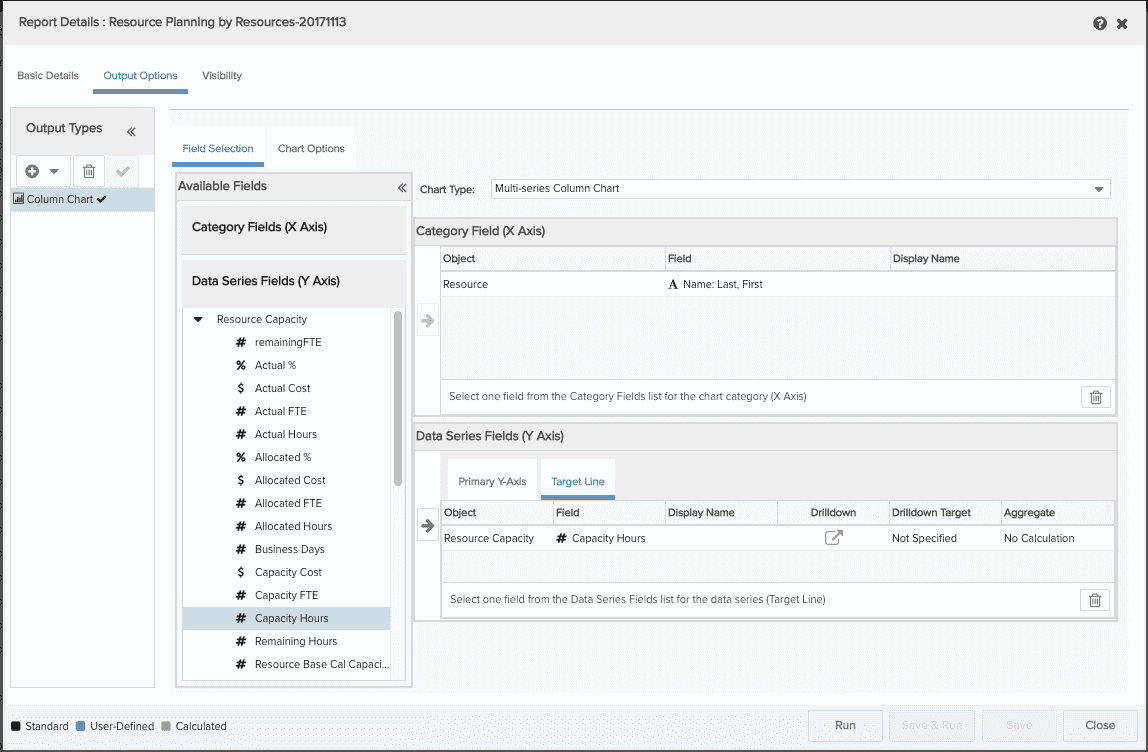
- On the Field Selection screen, choose Multi-Series Column.
- Configure the X-Axis fields as follows:
- From the Resource folder, choose Resource Name: Last, First
- Configure the Y-Axis as follows:
- Primary Y Axis: Resource Capacity: Allocated Hours
- Target Line: Resource Capacity: Capacity Hours
- Save & Run.
- Select Frequency and/or Filter.
- Run.
Example Report Output
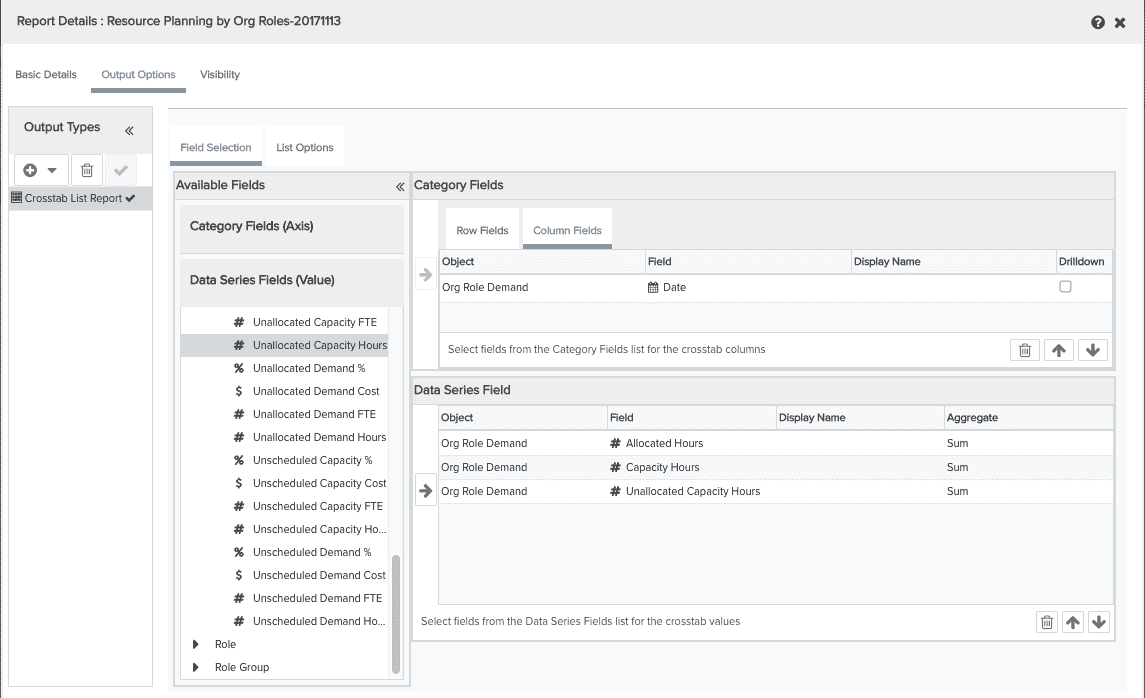
Capacity and Allocation by Role
- Navigate to the Reports tab and click the New button.
- Configure the Target and Category droplists: Target = Organization, Category = Resource Planning
- Choose the report source: Resource Planning by Org Roles
- For Output type, choose Crosstab List.
- On the Field Selection tab:
- Row Fields:
- Org Role Demand: Role
- Column Fields:
- Org Role Demand: Date
- Data Series Fields:
- Org Role Demand: Allocated Hours
- Org Role Demand: Capacity Hours
- Org Role Demand: Un-Allocated Capacity Hours (optional if you want to see the difference between Allocated and Capacity)
- Row Fields:
- Save & Run.
- Select Frequency and/or Filter.
- Run.
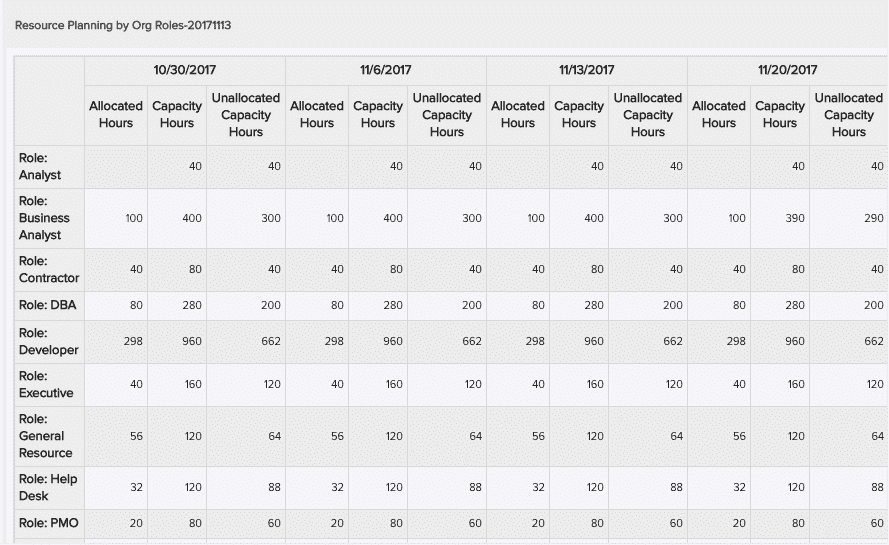
Example Report Output
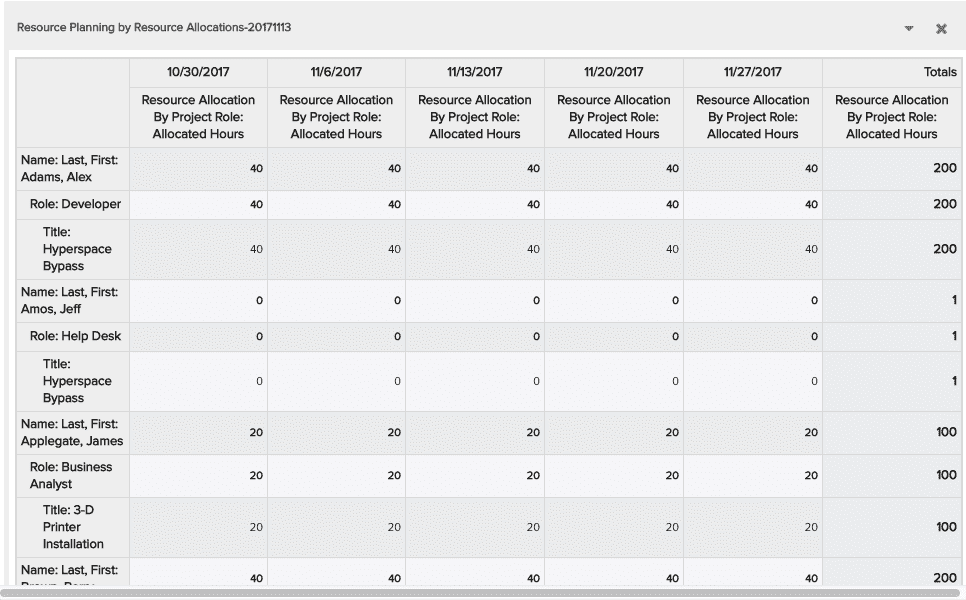
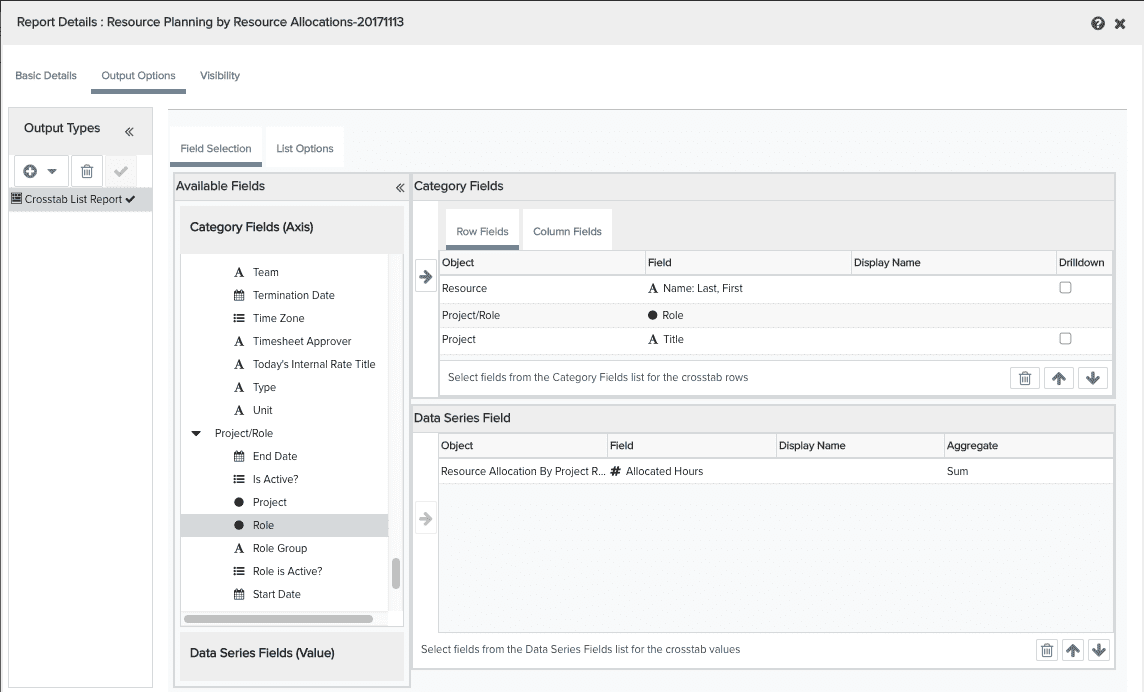
Capacity and Allocation by Resource
- Navigate to the Reports tab and click the New button.
- Configure the Target and Category droplists: Target = Organization, Category = Resource Planning
- Choose the report source: Resource Planning by Resource Allocations
- For Output type, choose Crosstab List.
- On the Field Selection tab:
- Row Fields:
- Resource Name: Last, First
- Project: Role
- Project: Title
- Column Fields:
- Resource Allocation by Project Role: Date
- Data Series Fields:
- Resource Allocation by Project Role: Allocated Hours
- Row Fields:
- On List Options, configure whether you want to see staffed or unstaffed allocations (this example show Staffed).
- Save & Run.
- Select Frequency and/or Filter.
- Run.
Example Report Output