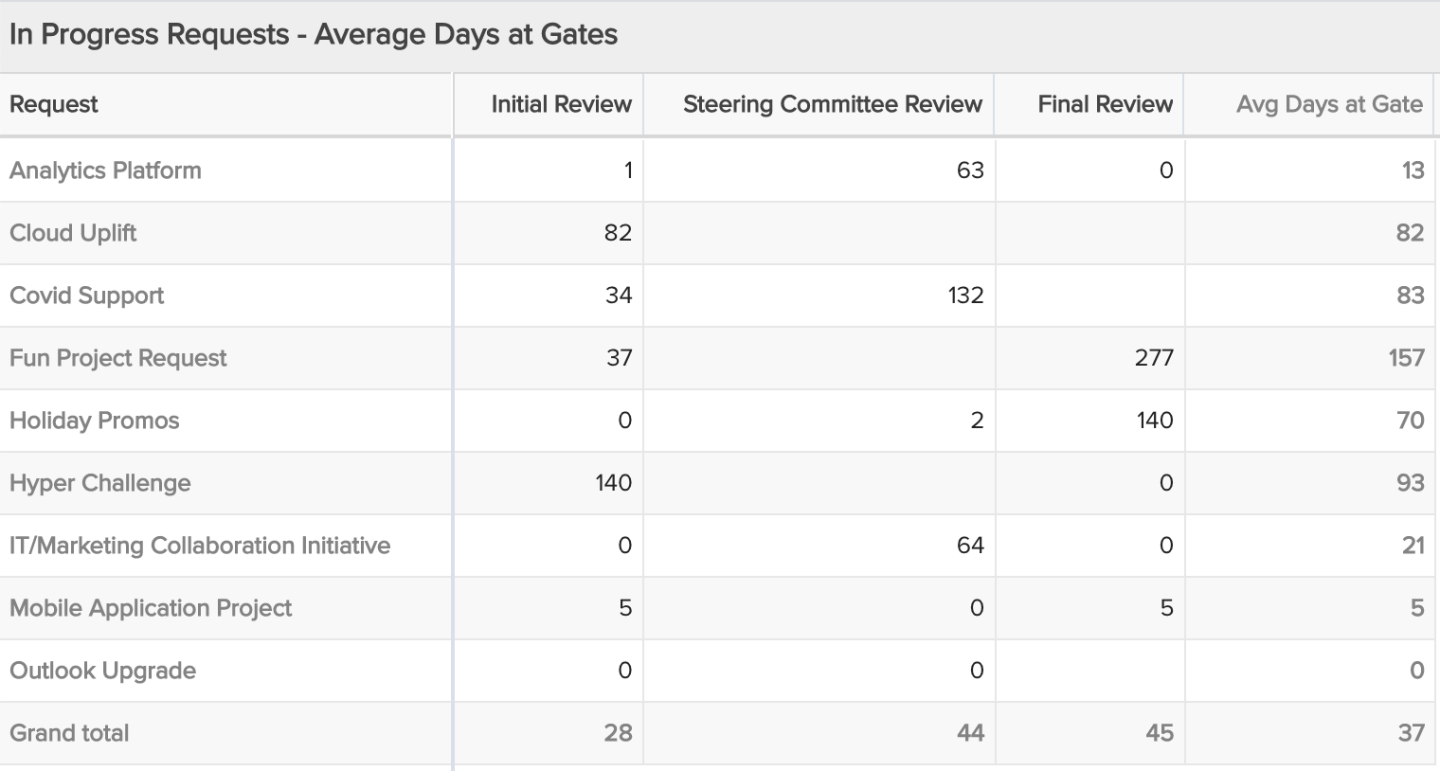
Request Average Days at Gates
Per request, see the total number of days it spent at each workflow gate and the overall average days at gates and overall average days for all requests per gate. You can build this report using the design settings in the table below. Alternatively, you can download this report definition and upload it to your PPM Pro instance.
| Design View | Selection | Comments |
|---|---|---|
| General |
Topic: Request Type: Crosstab Title: <enter a meaningful title>
|
|
| Data |
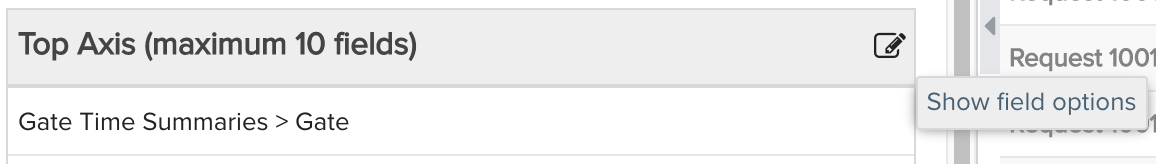
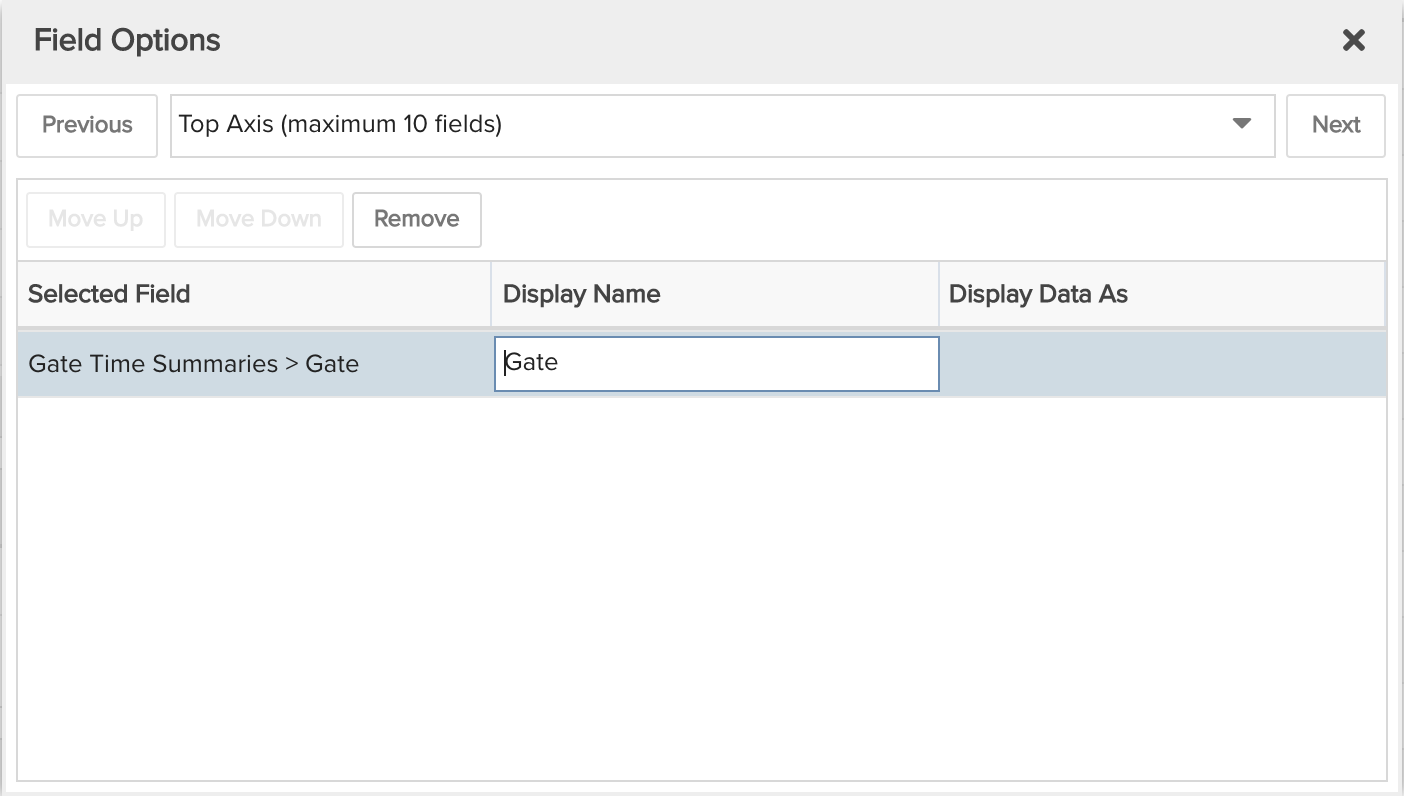
Top Axis: Whichever fields (up to 10) would be of value for breaking up the data, such as Request > Gate Time Summaries > Gate. Left Axis: Whichever fields (up to 10) would be of value for organizing requests, such as by Title. Values: Whichever fields (up to 10) would be of value for representing time spent at a gate, such as Request > Gate Time Summaries > Elapsed Gate Time (Days). To change the field title/heading value Display Name and Display Data as options, you can use the Field Options modal.
|
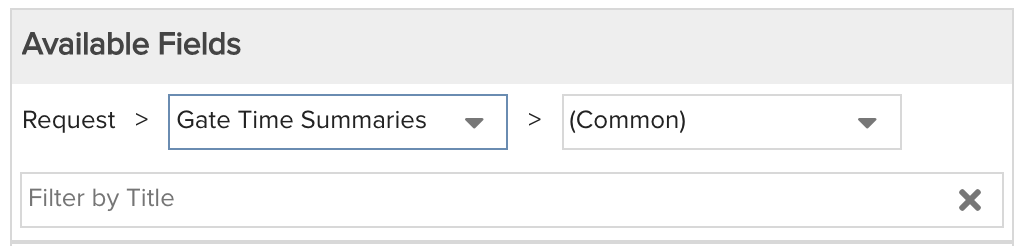
When starting with the Request topic you will need to select the field path Request > Gate Time Summaries to get to the time at gate-specific available fields. For example:
|
| Display |
Select desired options within the Display tab, such as Sorting, Drilldown, or Aggregation (including row and column subtotals and grand totals):
|
|
| Variable Settings |
Scope: Organization Filters: optionally include request filters, such as requests with Gate Status of In Progress specific and a specific request Category if you have multiple of these with different gate workflows
|
Selecting the Organization Scope will cause this report to be available on the Organization Report grid so it can be run per the organization. |