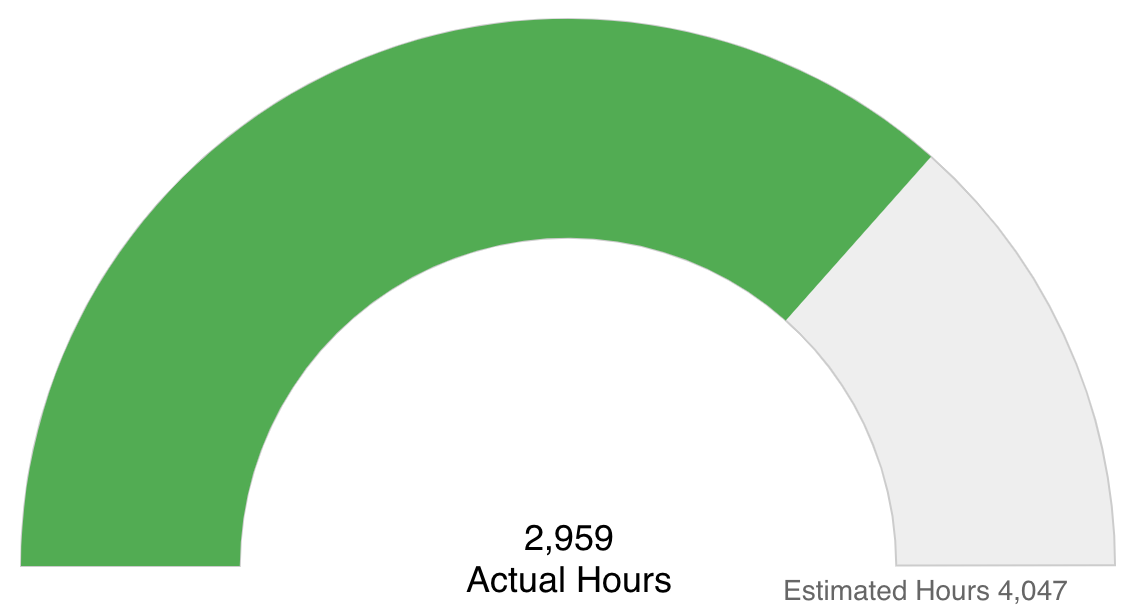
Project Actuals vs Estimated Hours
Shows the progress of a project's Actual Hours against Estimated Hours. You can build this report using the design settings in the table below. Alternatively, you can download this report definition and upload it to your PPM Pro instance.
| Design View | Selection | Comments |
|---|---|---|
| General |
Topic: Project Type: Gauge Title: <enter a meaningful title>
|
You can create a Gauge report for any entity by changing the Topic, for example to portfolio, task, project log, and so on. This example is for project. |
| Data |
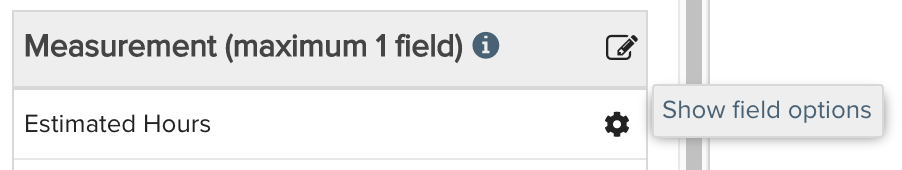
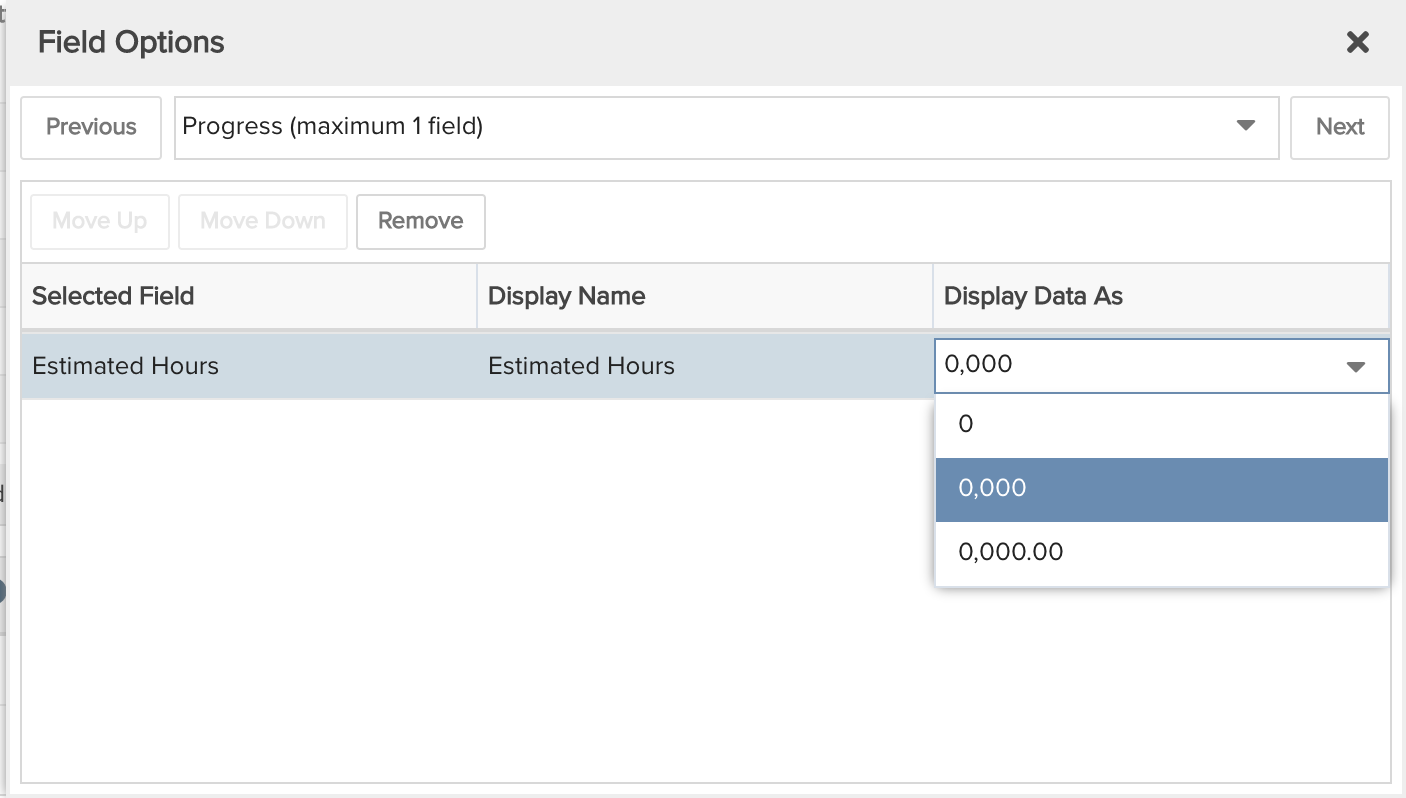
Progress Field: Select any numeric field you are measuring the progress of, for example, Actual Hours. Measurement Field: Select any numeric field you are measuring the progress against, for example, Estimated Hours. NOTE: if the selected Progress Field is a % format, do not select a Measurement Field because % is measured against 100%. To change the field title/heading value Display Name and Display Data as options, you can use the Field Options modal.
|
|
| Display |
Configure desired options within the Display tab, such as Headings, Data, Gauge Progress Color, Minimum/Maximum Boundaries display options, Drilldown, or Aggregation.
|
Note that the Gauge report only displays one color at a time. It will display the configured color based on the % of progress field to measurement field, or, in the case of a progress field that is % based itself then based on that % value.
|
| Variable Settings |
Scope: Project
|
Selecting the Project Scope will cause this report to be available on Project Report grids and subsequently can be added to project Dashboards. You can select other Scope options if you want this report to be shown in other entity grids as well, such as Portfolio to run across a set of projects belonging to a portfolio (again, make sure your Aggregation selection makes sense given the possible Scopes). As needed, you can also include Filters. If you want to allow the user to change to a different Scope and/or Filter before running the report or when viewing the report, select the relevant checkboxes for Allow changing. |