
Crosstab List reports
This topic describes how to configure the data for a Crosstab List report (click here for example). You will be working with a screen like the one below. At this point you will have already selected a report source, clicked New, and filled out a preliminary Basic Details screen.
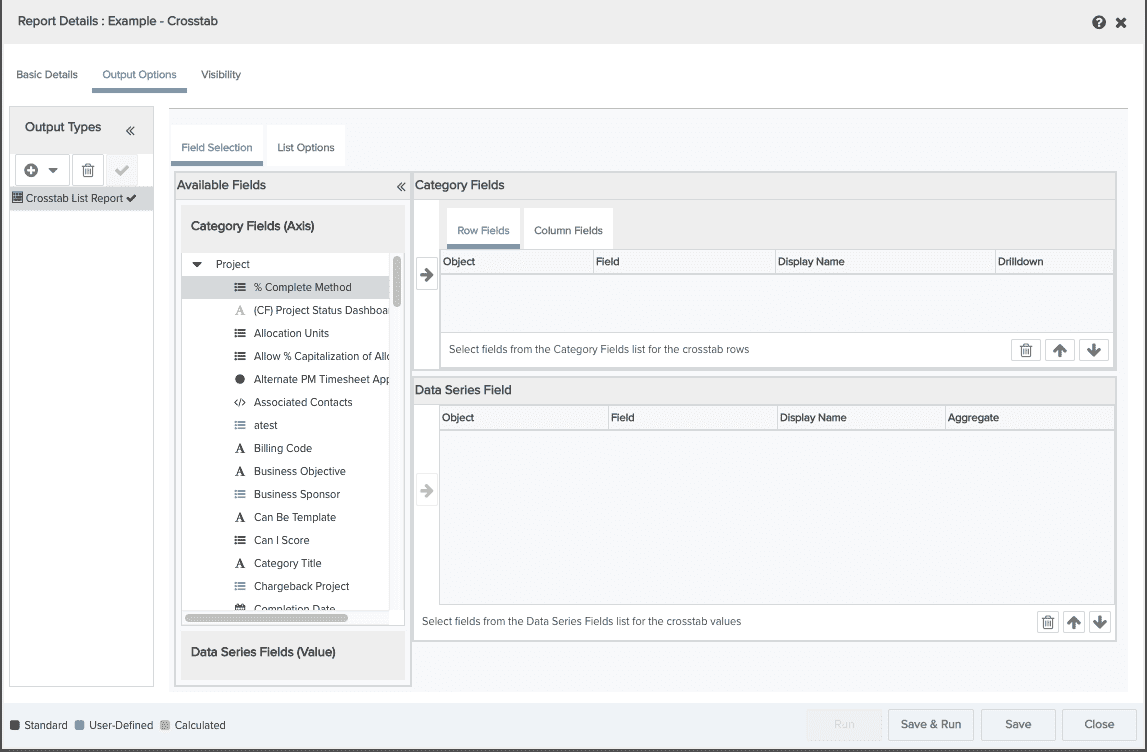
You can perform the following on the Output Options/Crosstab Report screen:
Field Selection tab
-
select the data for your report and order it
-
change the field's display name
-
include calculated fields
-
configure a drilldown
List Options tab
-
specify whether to display subtotals and grand totals
-
configure the legend position and field name typeface
-
choose the orientation of the value fields
-
specify the number of decimal places to display
-
set the report size
Select the data to be returned on the report
The Available Fields list shows all the Category fields and Data Series fields available for the report. These fields vary depending on the report source you are using.
A Crosstab report summarizes data across two or more variables. Data is grouped by Category (Row and Column) fields; at least one Row and one Column field is required. The summary calculation is performed on and displayed in Data Series fields; at least one Data Series field is required.
-
The maximum number of Category fields is 4 (row fields plus column fields). For example, you can use four row fields and one column field, or any combination that equals but does not exceed 5.
-
The maximum number of Data Series fields is 5.
-
An aggregate calculation is required.
To include fields in your report, locate them in the Available Fields list and drag or double-click them to the Selected Fields table. If you include fields and then change your mind, simply select the field in Selected Fields table and click the Trash Can ![]() .
.
The table below describes the Category Field table for the Rows/Columns:
|
Column Name |
Description |
|---|---|
|
Object |
The name of the entity to which the field belongs. |
|
Field |
The name of the Category field. This is the column/row name in the report. |
|
Display Name |
Allows you to enter a column name for the report that is different than the Field name. If this field is blank, the Field name is used for the column name. |
| Drilldown | Configure a drilldown for the field by clicking |
The table below describes the Data Series Field table:
|
Column Name |
Description |
|---|---|
|
Object |
The name of the entity to which the field belongs. |
|
Field |
The name of the data field. |
|
Display Name |
Allows you to enter a column name for the report that is different than the Field name. If this field is blank, the Field name is used for the column name. For the Data Series field, this name appears in the legend (if you choose to display one). |
|
Aggregate |
Perform a standard calculation: Sum, Minimum, Maximum, Average. |
Order the data columns
After you add the fields to the Selected Fields table, you can reorder them by dragging them up or down or by clicking the up and down arrows at the bottom-right of the table. The order in which the fields appear in this table is the order in which they appear on the report.
Change the display name
By default, the name in the Field column of Selected Fields table is the column name in the report. If you want to change the column name, enter the name in the Display Name column.
What next?
You can edit list options, save and run your crosstab report, change the default visibility, or configure other output types: