
Understanding Scenario Output
This video reviews the scenario output in PPA. Duration 6 min.
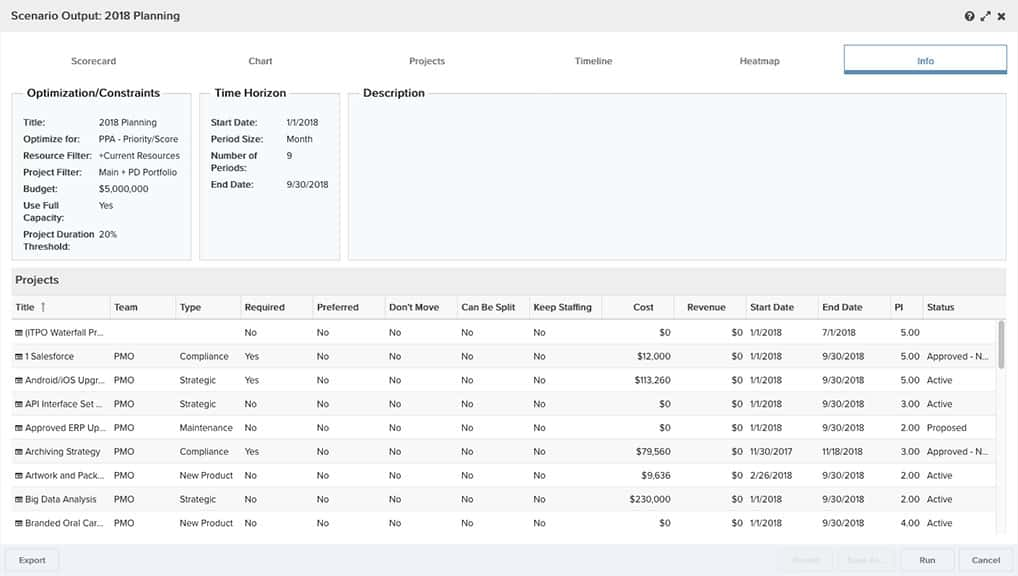
The results of the PPA scenario output are divided into 6 tabs:
All output views are read-only except the Projects tab, where you can move projects between the included/excluded lists and rerun or take other actions on the scenario.
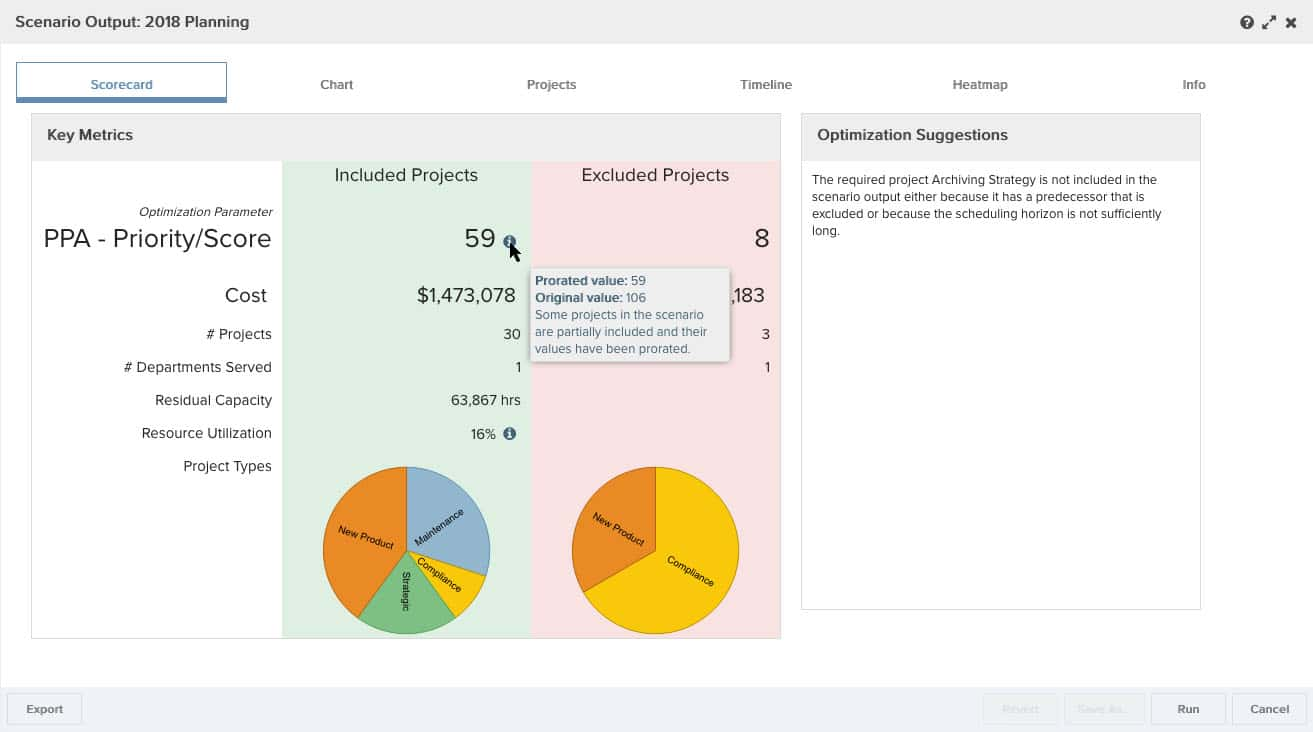
Scorecard
The Scorecard tab provides a high-level overview of the output. The Optimization field is displayed at the top, and the pie charts represent the project types that fall into the included as well as excluded category. Note that the optimization value will be prorated based on the percent of the project that is included in the scenario. If you have a project where only a portion of it is included in the scenario, both the cost and value sides are prorated. So if you have a project with optimization value 1000 and 50% of it is included in the scenario, you'll get a prorated optimization value of 500, which will contribute to the overall "score" of the scenario.
The Info icon displays the prorated value and the original value. See Thresholds and Defaults for more details on adjustments affecting proration.
Residual capacity is the remaining capacity after resources that were included in the scenario have been assigned. See Interpreting Capacity for more details.
Resource utilization is the percentage of resources allocated (allocation/capacity).
About Costs
Project costs for PPA are taken from allocations (labor costs), task costs (non-labor costs derived from summary tasks), and financial entry costs. Labor costs are based on role rates (not the resource rate).
A pro-rated cost is computed for the project when the scenario output is displayed. For "included" projects this will be the prorated cost for the portion of the project that's actually included in the scenario. For "excluded" projects, this is the prorated cost based on the full planning horizon (e.g. if the project is 18 months long and the scenario is 12 months long, the prorated cost shown will be 2/3 of the project cost).
About Utilization Calculations
Note that utilization calculations are influenced by the Use Full Resource Capacity setting. If this property is not selected, whatever resources are already allocated to projects outside of the scenario will remain committed to those projects.
The Heatmap always will reflect available capacity across all projects, those included in the scenario and those outside of the scenario, therefore the Use Full Resource Capacity setting does not impact it. This is because the Heatmap cares how utilized someone (or some role) is; you'd still want "fully utilized" to be 100% so combining the external projects and the scenario projects makes sense.
The Timeline cares more about where included scenario projects fall on the time horizon and if there are any odd role spikes or valleys across your time horizon. When the Use Full Resource Capacity setting is not selected, the Timeline column chart at the bottom representing the top four roles will show both the resource utilization on projects included in the scenario (solid colors) and resource utilization on projects not included in the scenario (striped colors). When the Use Full Resource Capacity setting is selected, only the resource utilization on projects included in the scenario is shown (solid colors) since it inherently includes full resource capacity.
Optimization Suggestions
PPA potentially generates optimization suggestions, which when available appear on the Scorecard tab (either next to or below the scorecard). Suggestions are generated by analyzing shortfall data and calling attention to opportunities to improve the scenario value at small incremental cost. We hope that these suggestions will help decision makers zero in on potential adjustments without having to read through all the excluded projects. The following are situations that might trigger a suggestion:
-
If at least one excluded project is missing no more than a single role, the engine will return a suggestion that references that role.
-
If some excluded project is short on budget, but is otherwise not missing any roles, the engine then will return a suggestion that references the budget shortage.
-
When an excluded project has shortfalls that are small in comparison to the incremental gain in value the schedule would enjoy if the project were included, the engine will generate a suggestion that references the incremental cost needed to include the project where cost is the sum of both resource and budget shortfalls.
-
When a group of excluded projects is determined to have a collective value in excess of 10% of the scheduled projects' value, the engine will generate a suggestion referencing those projects.
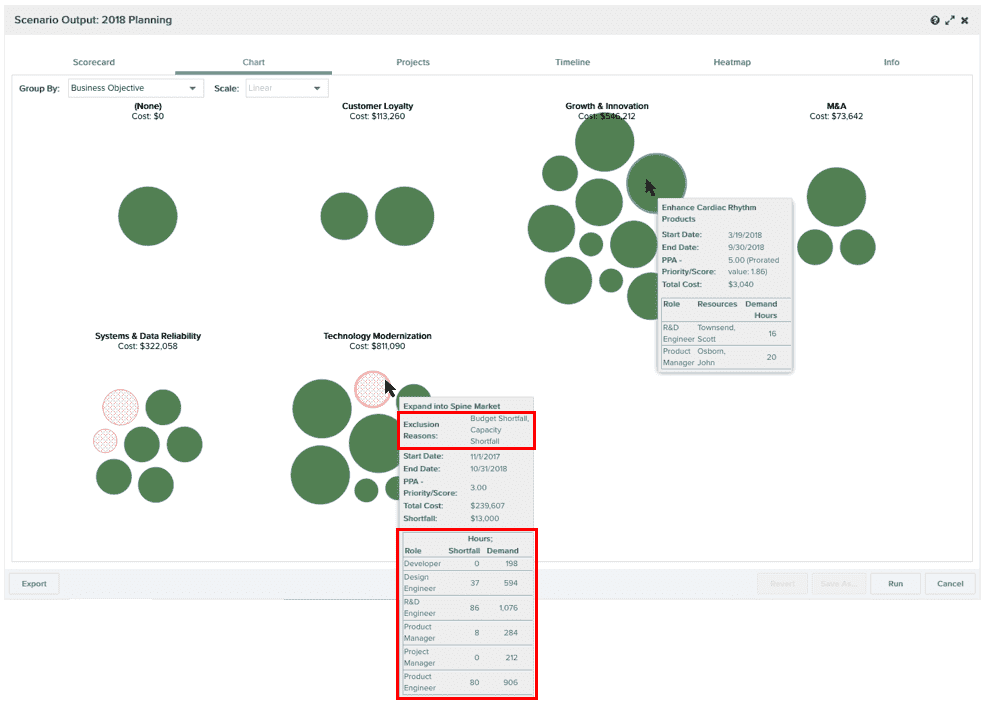
Chart
The Bubble chart is a visual representation of your optimization results. Green bubbles represent included projects, red represent excluded projects. You can hover-over any bubble to view details.
Group By
Select a value from the Group By droplist to arrange projects according to the selected field value, if any. This droplist is configured when the PPA environment is set up and typically uses fields like Project Type, Department, Status, and so on. If there are no values in the droplist, then none were configured.
Scale
-
Choose Linear to display the bubbles sized proportionally according to the value of the optimization field. For example, if the optimization values of two projects were 10 and 1000, on a linear scale the diameter of the larger bubble would be 100 times larger than the smaller bubble.
-
Choose Logarithmic to size the bubbles according to a logarithmic scale in order to provide more readable output. This scale is useful when the difference in optimization values between projects is very large. For example, if the optimization values of two projects were 10 and 1000, on a logarithmic scale (assuming base 10), log 1000 to base 10 is 3, so the diameter of the larger bubble would be 3 times larger than the smaller bubble.
Projects
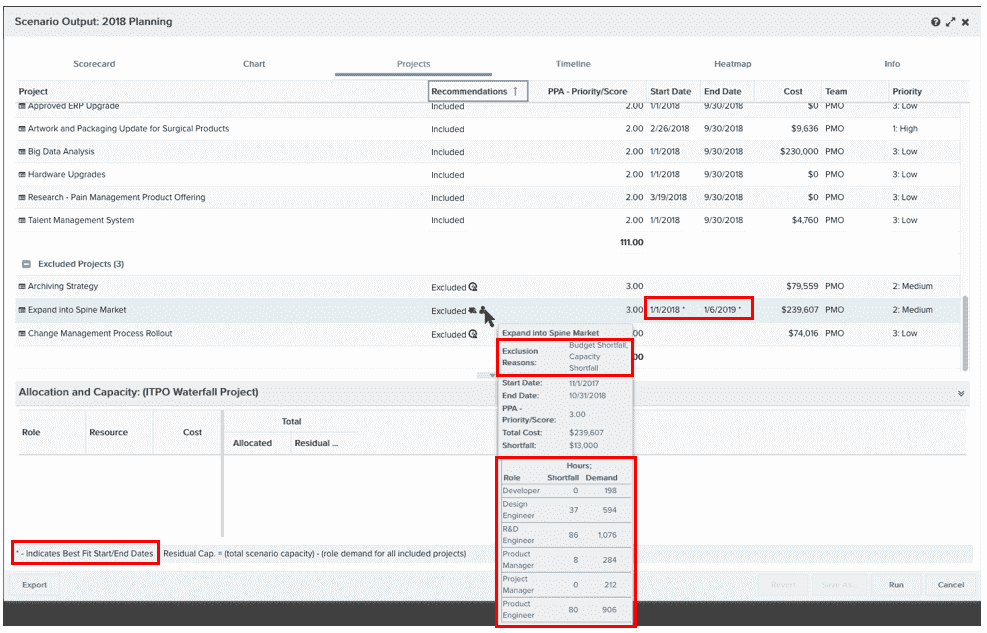
The Projects tab displays a list of included and excluded projects in the top pane. Select a project (either included or excluded), and view its contours in the lower pane.
About Project Shortfalls
If a project was not included in the results, it means that you can realize more value (based on the optimization parameter) by including a different set of projects, given the constraints of budget, time, and resources. For each excluded project, one or more exclusion reasons are provided to help understand specifically which of the constraining factors led to that project being excluded.
Note that the PPA system respects project dependencies, and will make sure predecessor projects are scheduled prior to successor projects. The engine will also consider the score of the entire set of dependent projects during the scheduling process.
Exclusion reasons
There are 4 reasons a project can be excluded from a scenario. Each type is represented by an icon, shown below.
 Budget - Not enough budget to accommodate this project. There is insufficient budget in one or more weeks of the planning horizon.
 Dependency - This project depends on another project which was either excluded or placed too late in the scenario timeline to enable this project to fit in.
 Resource - One or more roles do not have enough capacity. There is insufficient capacity in one or more weeks of the planning horizon for the identified roles.
 Timeline - This project is too long. The total length of the project, plus any predecessors, exceeds the planning horizon by more than is allowed by the partial allocation threshold.
You'll see this exclusion information when you hover over a project in the Projects list, bubble Chart, or Timeline. For example:
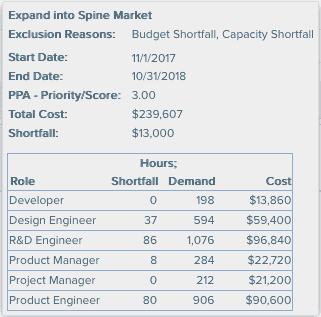
Types of details for included vs excluded projects will differ. Included projects display information such as resource recommendations, project costs and the optimization parameter value. For excluded project details, the information shown is based on why the project was excluded. For example, in the case of a capacity shortfall, the details show the shortfall by role.
It's important to note that exclusions are calculated individually. They are intended to provide a general idea of why a particular project was excluded and identify significant gaps in capacity in particular roles. There is no guarantee that increasing the budget, resource capacity, or timeline by the shortfall amount will result in an excluded project being included in a subsequent run, because other higher-value projects could be included or shifted, consuming that extra capacity. The PPA engine will always attempt to obtain the highest aggregate value of the optimization parameter, given the constraints of resources, budget, and time.
"Best Fit" dates
For each excluded project, the engine calculates the spot where the minimal shortfall will occur; for resource and budget shortfalls, these dates are presented as "best fit" dates on the Projects output tab (see below). Budget and resource shortfalls are calculated by examining the difference between the residual budget/capacity and the project's cost/demand at the point in the schedule represented by the "best fit" date. Again, remember that each excluded project is analyzed individually.
Included/Excluded Projects
You can drag a project from one category to the other and rerun the scenario by clicking Save. The new results will be displayed in the output. If you want to preserve the initial scenario results, click Save As to rename the scenario when prompted and re-run the scenario. In addition, if you make any edits to the scenario, such as including/excluding, Save As automatically reruns the scenario.
Hover over any recommendation icon to view details.
Note that for Resource or Budget shortfalls, the engine calculates "best fit" dates, which are the dates the engine used to calculate the smallest shortfall for that particular project. See "Best Fit" dates above.
Demand and Capacity
The Demand and Capacity pane displays resource-level contours for included projects. Each contour includes a resource and their capacity for that time period (either full capacity or that available to PPA, depending on the "Use full capacity" setting). It's possible to have a contour with no resource specified if you have required projects but have insufficient capacity to cover them.
For excluded projects, role-level contours include demand and residual capacity. Residual capacity (for a role) is computed by taking the total capacity available to the scenario for all resources in the resource filter who have this role (either full capacity or that available to PPA, depending on the "Use full resource capacity" setting), and then subtracting the role demand for each of the included projects in the scenario. Note that a role can be a primary or secondary organization role.
Timeline
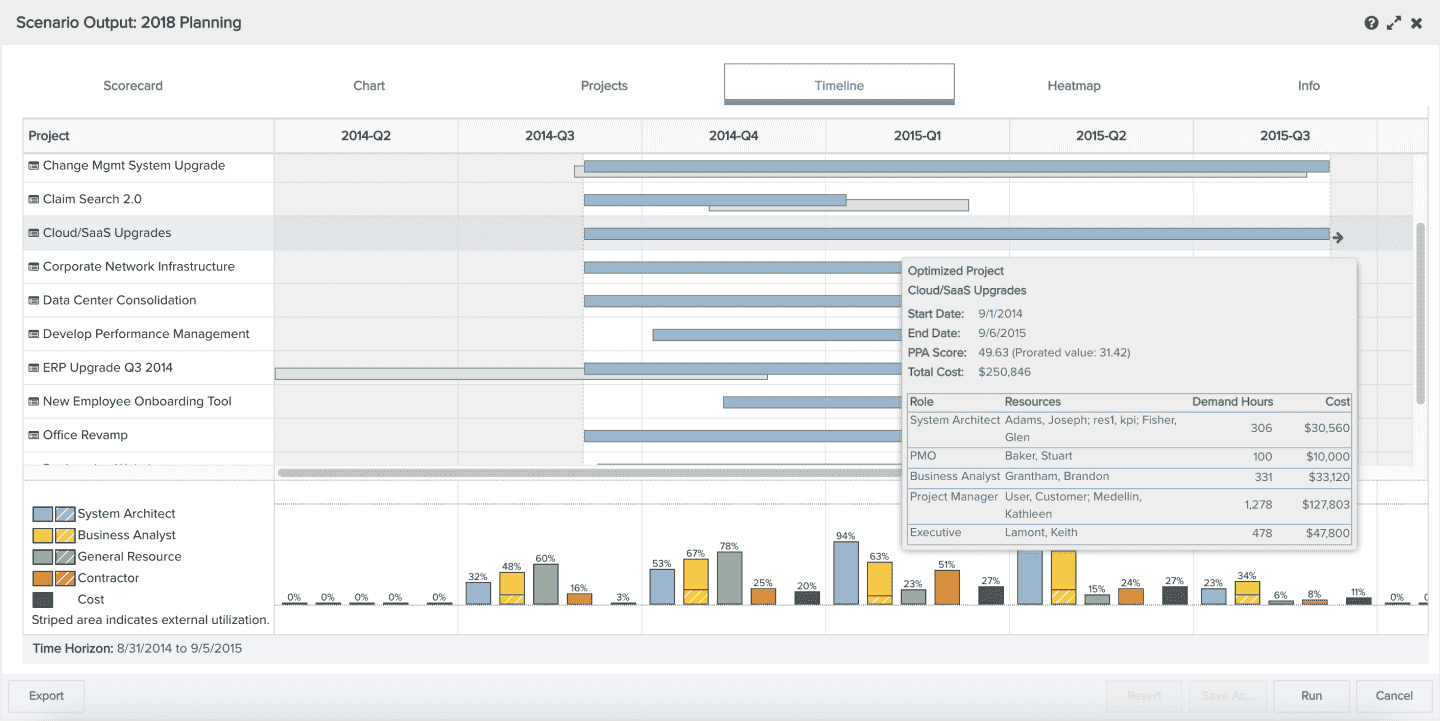
The Timeline displays a Gantt chart showing % utilization (allocated hours / capacity hours * 100) for each period for all the included projects (see Interpreting Capacity for more information). The white background represents the planning horizon. A light gray bar represents an original project, and its corresponding blue bar represent the optimized/shifted version of the project. A blue bar without a gray bar means that the project did not need to shift dates. Hover over any bar to view details.
The column chart at the bottom of the screen shows the top four Roles (based on highest utilized roles). The legend to the left identifies the roles.
The darkest column represents cost:
-
If you included a budget constraint amount in the scenario, the column represents the percent of money spent in that period out of the specified budget amount for that period (budget is prorated per period).
-
If there is no budget constraint, then the column represents the percent of actual money spent in that interval relative to the total cost of the project over the time horizon (all the cost columns will add up to 100%).
The striped portion of each column represents resource utilization on projects not included in the scenario. You only see striping if the Use Full Resource Capacity option is not selected.
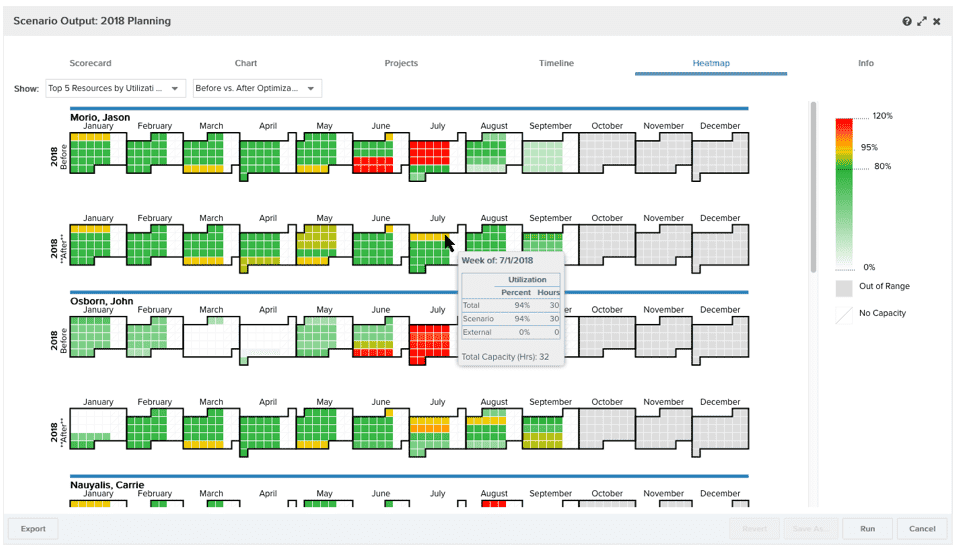
Heatmaps
Heatmaps provide a visualization of role/resource utilization over a time horizon. It allows you to see if you might be able to work on more projects if you had additional roles or people. For example, if you were short on Testers but had ample Developers, perhaps you could ask some Developers to take on a Tester role for a time.
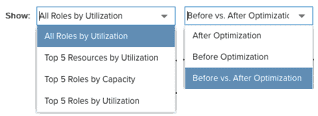
You can display heatmaps for the top 5 roles by utilization or capacity, and top 5 resources by utilization. You can display heatmaps before optimization, after optimization, and before & after optimization together. The default heatmap type is configured during PPA setup. As noted earlier, the Heatmap always will reflect available capacity across all projects, those included in the scenario and those outside of the scenario. This is because the Heatmap cares how utilized someone (or some role) is; you'd still want "fully utilized" to be 100% so combining the external projects and the scenario projects makes sense.
Hover over any week to view details.
Scenario Actions
Every scenario output has the following possible actions, represented by buttons at the bottom of the screen:
-
Export - Export scenario output details to Excel.
-
Revert - Undo any changes made on the Projects tab to included/excluded projects.
-
Save As - Save a copy of the scenario with modified included/excluded projects and run again.
-
Run/Save - Run the scenario again to account for changes in the project or resource data since the last time the scenario was run. If on the Projects tab you modified included/excluded projects, this button label changes to Save such that clicking it saves your changes and runs the scenario.
-
Cancel - Close the scenario output window, canceling any unsaved modifications that were made on the Projects tab.