
Content Tab
The Content tab of the dashboard designer is where you choose the reports to include in the dashboard. The Available Reports section displays the reports that are available for the dashboard that you are permitted to access.
Once you drop a report in the Preview pane, you can rearrange and resize report components directly in the Preview pane. In addition, you can change report properties if you wish to tailor the report component to the dashboard. For example, you can edit report elements such as the report container title, headings, fonts, column header wrapping, auto-sizing, runtime options (exact settings determined by component output type) - none of these settings will affect the original report definition. See Editing Dashboard Report Components for information.
Feel free to visit other tabs - General, Display, Scope, Team - tabs, as well as Using the Dashboard Designer for general information about the dashboard designer.
Adding Reports to a Dashboard
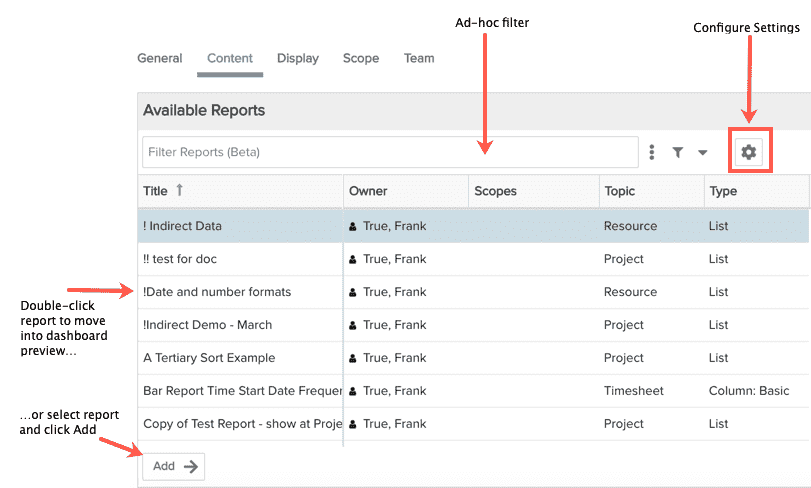
The Available Reports section displays a filterable list of all reports you (the current user) have access to. An ad-hoc filter at the top of the list lets you develop new/use existing filters to fine-tune the list of reports. You can also control which columns to display in the Available Reports section by clicking the gear  icon to open the Configure Settings dialog, where you can rearrange the fields you want to show or remove from the section.
The screenshot below shows the Available Reports section - note that the view was adjusted to expand the left side of the tab by grabbing the resize bar in the middle of the window and dragging to the right (shrinking the Preview Pane):
|
|
To add a report component to a dashboard: Use the ad-hoc filter to show only the reports you are interested in. Simply move the report(s) to the Preview Pane using one of the methods described to the left:
Use your cursor to move/rearrange/resize reports. Their size/placement will persist once you save. To resize a report, simply hold your cursor on the report boundary until you see an arrow |
 and drag until the report is the size you want. For example, you can stretch (or shrink) a report to be the same width as one above or below it.
How do Changes to Report Definition Impact Dashboard Components
Changes to the Reports used in Dashboards will impact the Dashboard component with the exception of Headings and Variable Settings. Gantt Chart options available in the preview panel like Color By and Gantt Settings are inherited from the Gantt Report setup.
- Data Tab - all changes reflected on Dashboard component
- Display Tab - all changes reflected on Dashboard component EXCEPT Headings
- Variable Settings - are controlled at the Dashboard-level and changes to Report Variable Settings will not be reflected
- Headings - are controlled at the Dashboard-level and changes to Report Variable Settings will not be reflected
Gantt Report Note: while the Gantt options for Color By and Gantt Settings gear icon option are displayed on the preview panel for the Dashboard component, these settings are being inherited from the Report and can't be saved at a Dashboard level.