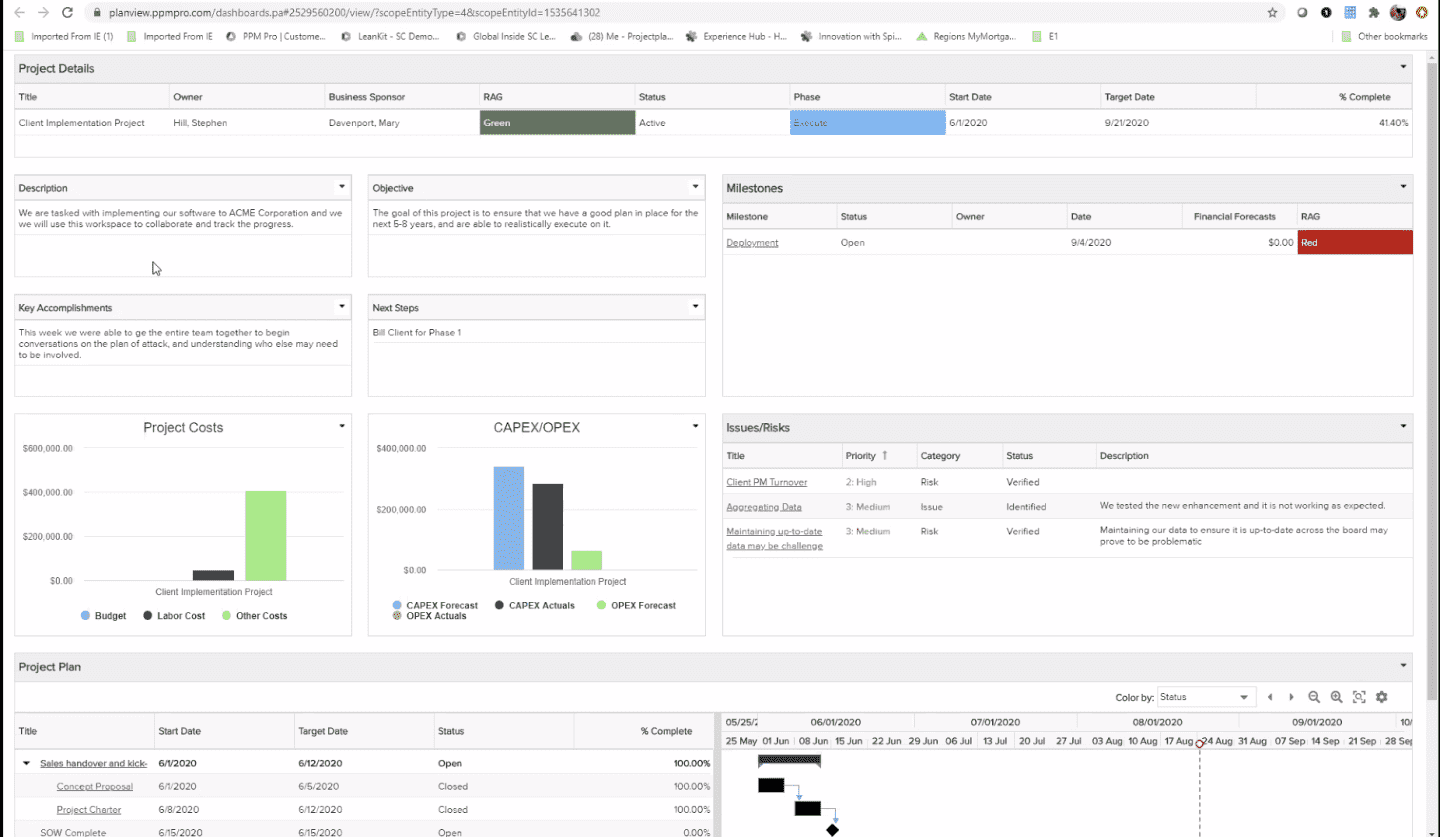
Project Status Dashboard
This dashboard provides a consolidated view of a project's important details, overall status and health, key milestones, issues and risks, costs, and the project plan so that progress can be monitored and adjustments made when needed to ensure on-time and on-budget delivery. The reports on the dashboard below are a sample of ways to achieve these goals. You'll want to identify the most important information and metrics for your project managers, stakeholders and other decision-makers, then build reports and configure a dashboard to highlight that data.
| Design View | Selection | Comments |
|---|---|---|
| General |
Title: <enter a meaningful title>
|
|
| Content (general) |
Search or browse for the reports you want to add to the dashboard, then either drag and drop into the Preview area, or select and click the Add button. Once they appear in the Preview pane, click and drag to rearrange or hover and click a bottom corner to resize. For the specific Content reports listed below, ideally you will be able to identify corresponding fields to match the spirit of each report visualization you want to include on your own dashboard. If you do not have one or more fields, you can add them to your relevant entity details (standard fields, user defined fields, or calculated fields) and bulk edit or data import to provide field values as appropriate. |
|
|
Content report - Project Details (List: Basic)
|
This is similar to the Portfolio Project Status report recipe, except for:
|
|
|
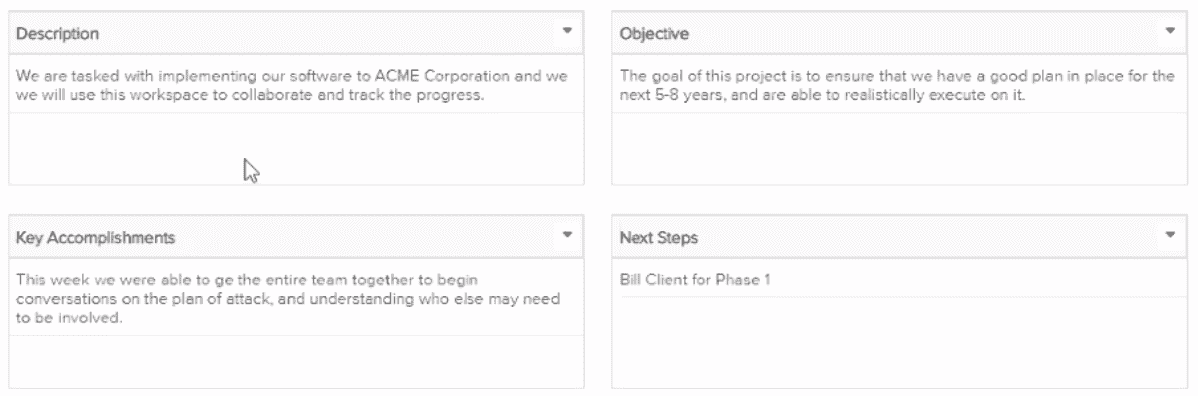
Content report - Project Key Info (List: Basic)
|
Each of these four reports are simply List: Basic reports with one field shown (Description, Objective, Key Accomplishments, and Next Steps). You can reference the Portfolio Project Status report recipe, except for:
|
|
|
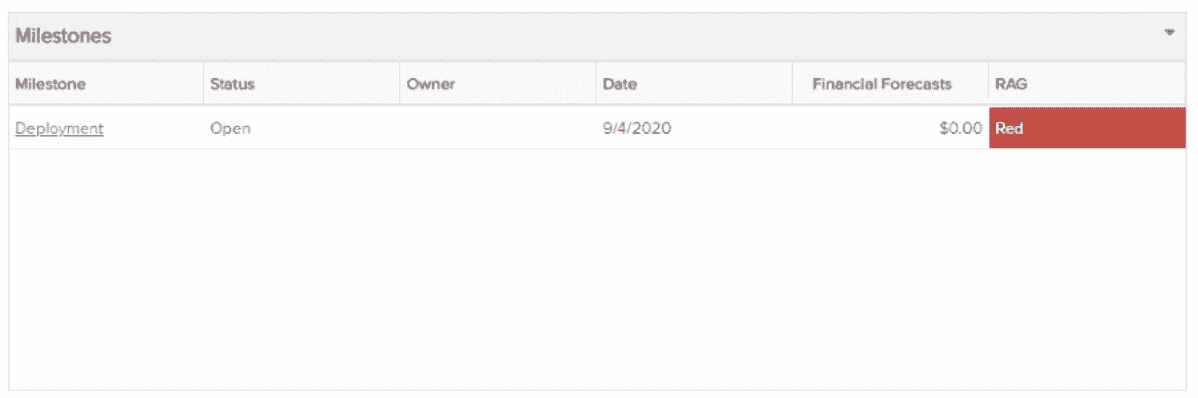
Content report - Milestones (List: Basic)
|
This is similar to the Portfolio Project Status report recipe, except for:
|
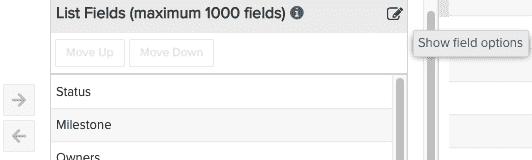
To change the data field labels, for example from "Start Date" to "Date", within the Left Axis area title select the edit icon for "Show Field Options" and in the resulting "Field Options" modal, edit the field "Display Name".
|
|
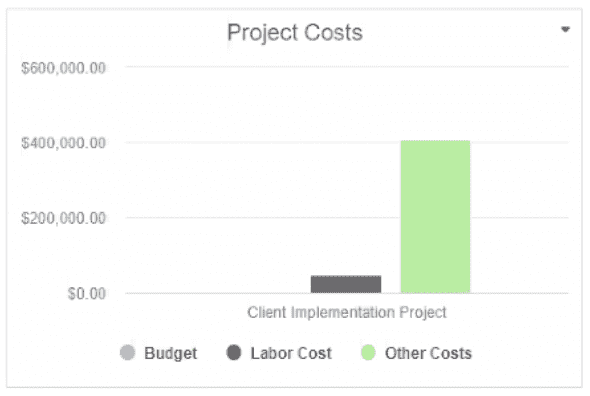
Content report - Project Costs (Column: Basic)
|
This is similar to the Planned vs. Actuals report recipe, except for:
|
|
|
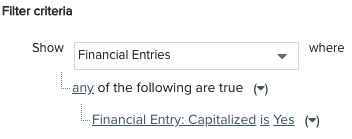
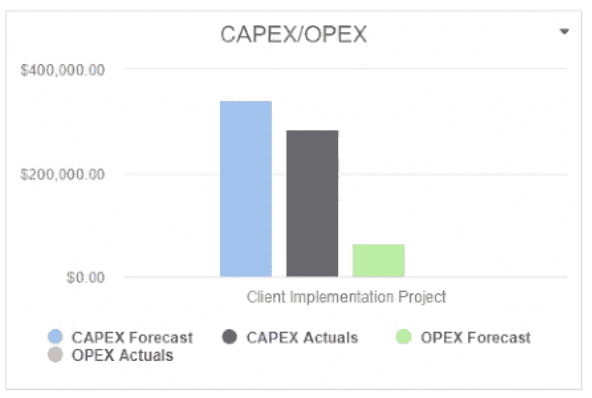
Content report - Capex vs. Opex (Column: Basic)
|
This is similar to the Planned vs. Actuals report recipe, except for:
|
See Calculated Fields Cookbook recipe #27 Simple Financial Entry Capitalized/Non-Capitalized Forecasts/Actuals, for examples of how to create calculated fields using financial entry forecasts and actuals.
|
|
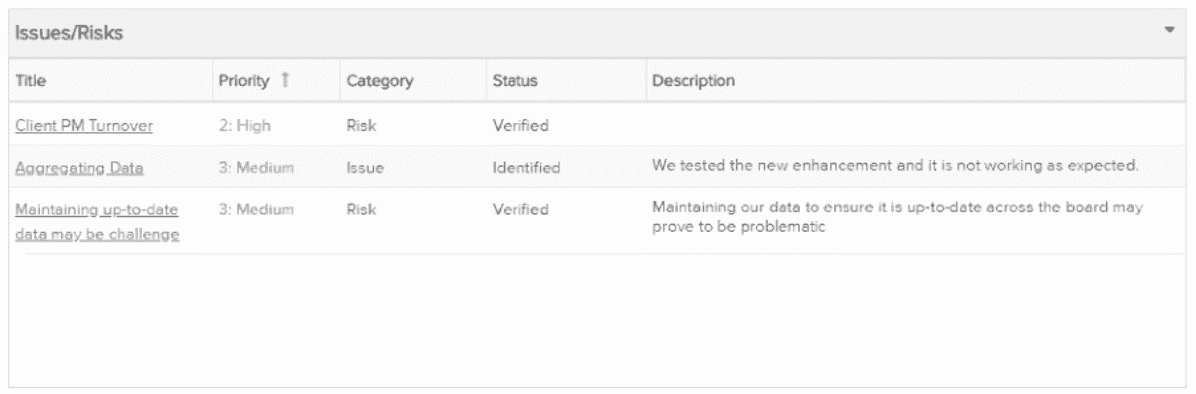
Content report - Issues/Risks (List: Basic)
|
This is similar to the Portfolio Project Status report recipe, except for:
|
|
|
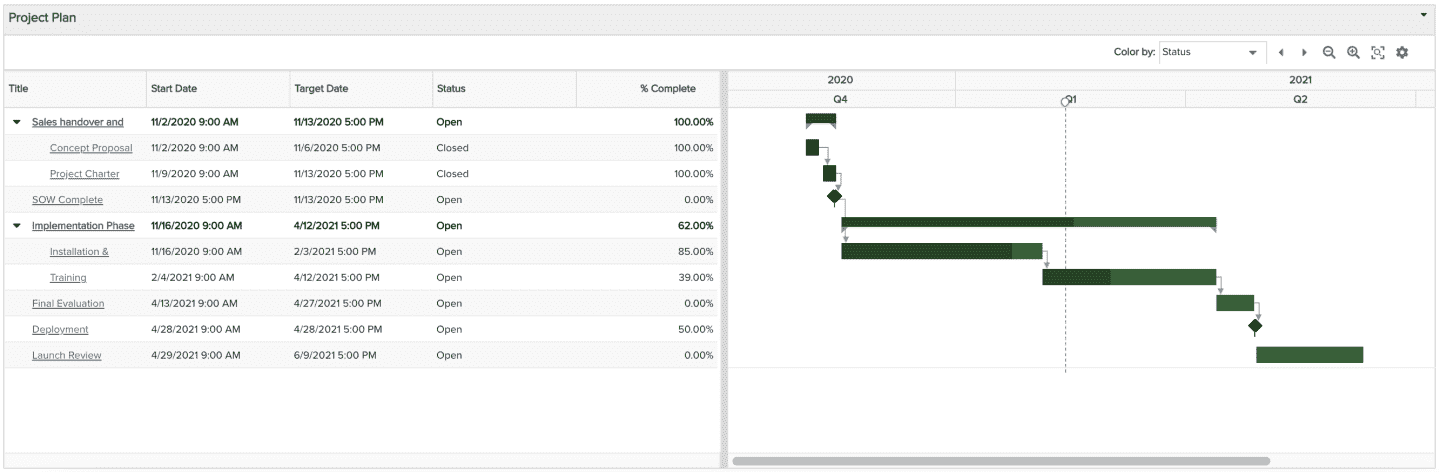
Content report - Project Plan (Gantt)
|
This is the same as the Portfolio Roadmap report recipe, except that the Scope is set to Project and you can vary what List Fields you would like to show (such as Title, Start Date, Target Date, Status, % Complete).
|
|
| Display and Preview |
Provide a Container Title if you'd like specific text to appear on the dashboard title bar. Select to Show run/published as and date information at bottom to help users understand who the dashboard is viewed as and at what time. This is particularly helpful for published dashboards that are initially run as the dashboard publisher at an earlier day/time. |
|
| Scope |
Scope: Project
|
Selecting the 'Project' Scope will cause this dashboard to be available on the Project dashboard grids so it can be run from there. If you would like this dashboard to be available for selection from a Project's Overview section, select Project Overview. |